Regional Economic Pulse - Second Quarter of 2026
The Regional Economic Pulse indicators and their report are constructed based on surveys to businesspeople and executives who are asked about their perception of the dynamics of their economic activity in the annual comparison and on available statistical information. It is prepared by the Regional Economies Section of the Technical and Economic Information Department of Banco de la República (the Central Bank of Colombia). The content is solely the responsibility of the authors and does not commit Banco de la República or its Board of Directors.
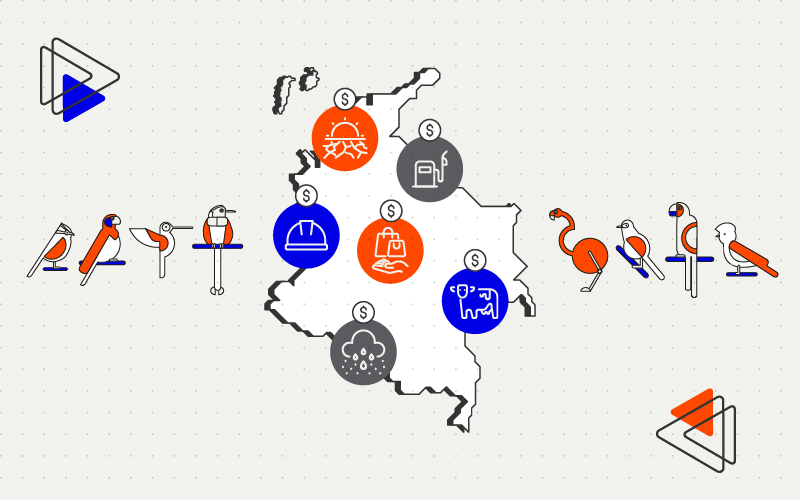
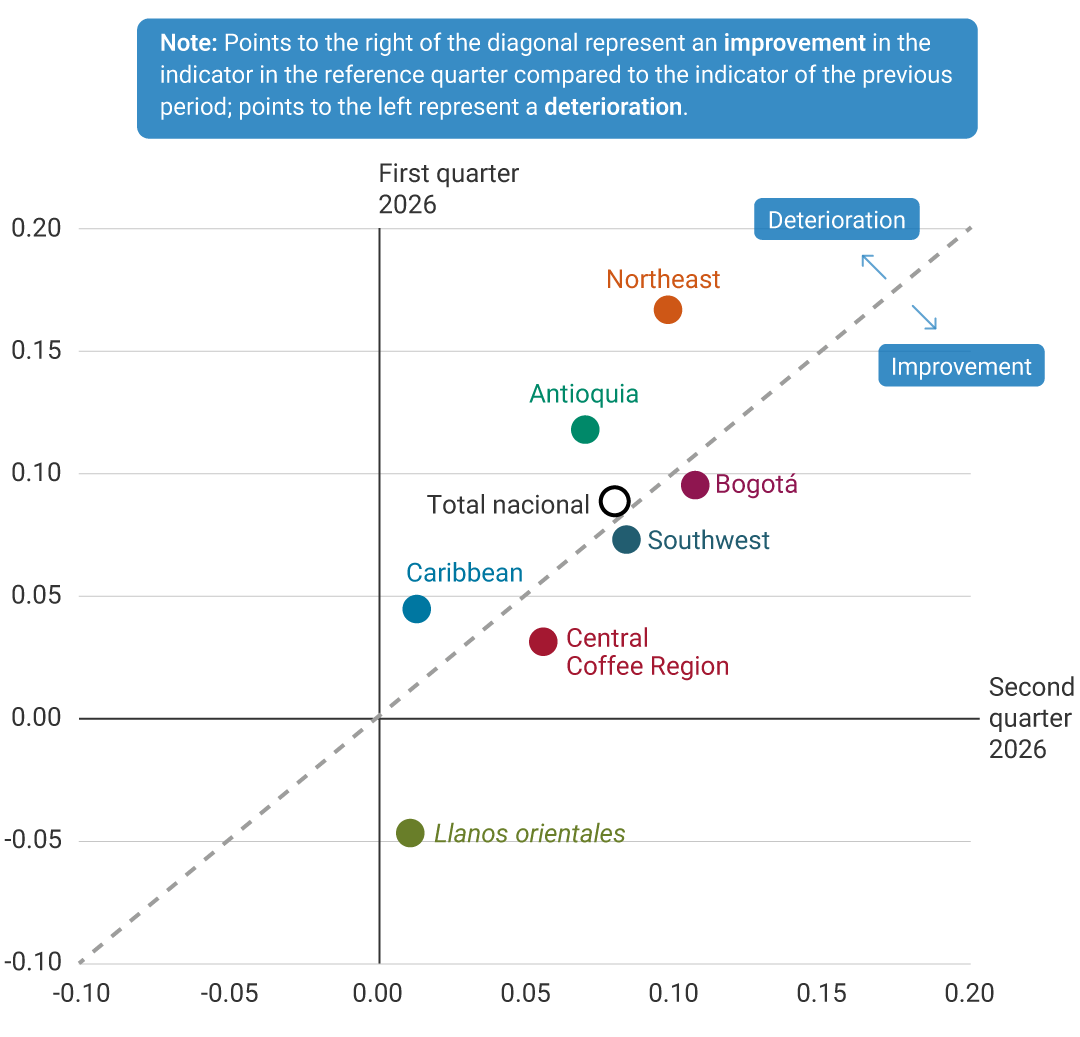
During the second quarter of 2026, regional economies would have recorded year-on-year increases. Bogotá, the Northeast, and the Southwest likely recorded the strongest growth, driven by domestic trade. The expansion of durable goods sales, particularly of technological products and new vehicles, contributed to growth accross all regions. Antioquia, the Caribbean, and Llanos Orientales also likely experienced increases, although below the national figure. In these regions, the decline in agricultural activity constrained growth, together with the decrease in new housing sales.
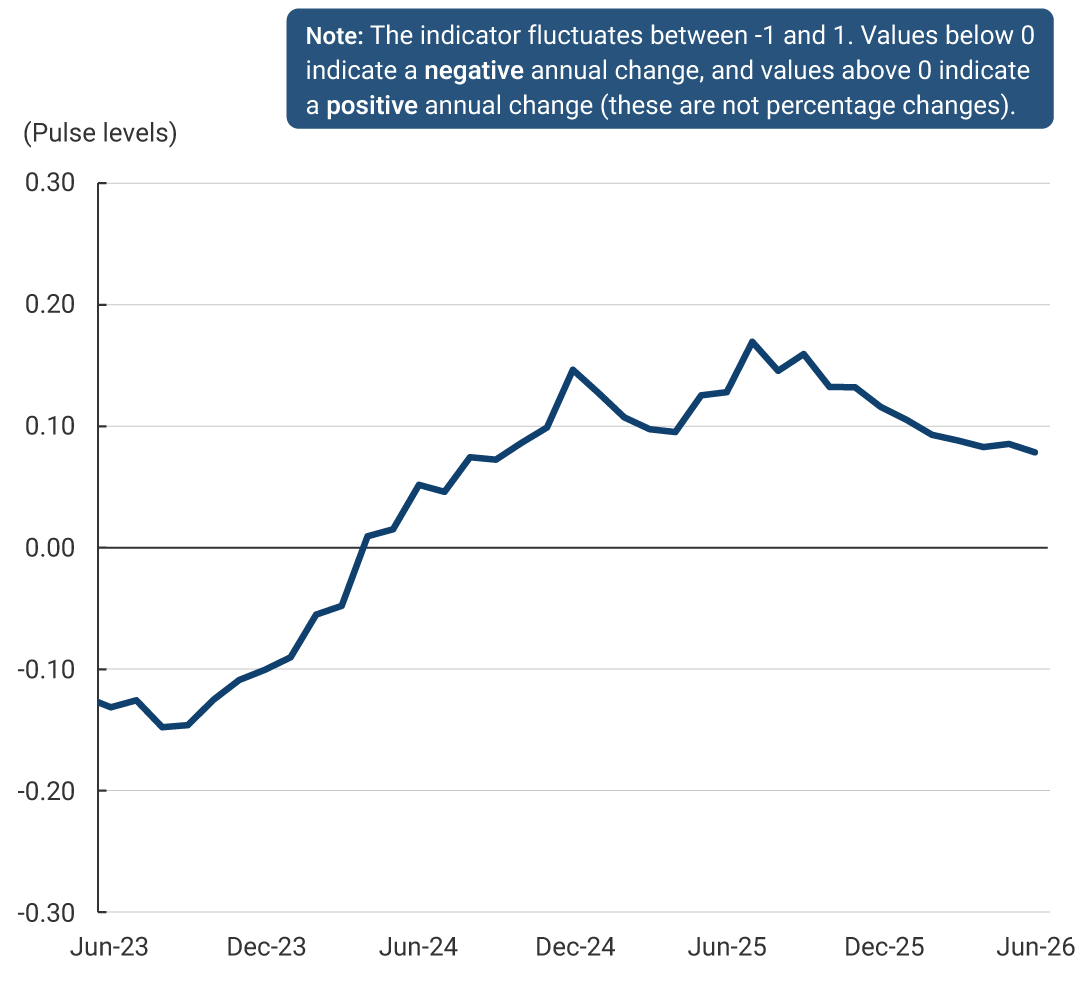
According to the Regional Economic Pulse (PER, by its Spanish acronym) indicator, the national economy would have grown in the second quarter of 2026 at a pace similar to that observed in previous periods (Graph 1). The positive performance of all regional economies would continue to be driven by the strength of trade, particularly by durable goods consumption. However, households and firms would have been cautious in their spending and investment decisions due to persistent economic and political uncertainty, according to the perceptions reported by interviewers.
Rolling quarter average
Economic activity likely increased in all regions, and in most cases, growth was higher than that observed in the previous quarter (Graph 2). Bogotá was the best-performing regional economy and, together with the Northeast and the Southwest, exceeded the national indicator. In these regions, this performance would be associated with an increase in domestic trade, particularly sales of technology products, household appliances and consumer electronics, and food, according to PER sources. Higher sales of motorcycles and new vehicles also contributed, with the latter supported by demand for new models, particularly hybrid and electric vehicles. In the Northeast and the Southwest, the agricultural sector and industry also posted strong results. Within the latter, food and beverage manufacturing would have grown due to stronger demand and favorable availability of raw materials. In addition, in the southern part of the country, demand for local products would have increased amid a lower supply of goods from Ecuador. Likewise, the economies of Antioquia and the Central Coffee Region would also have grown, with trade as the main driver, in response to household spending dynamics, according to PER perceptions. In Antioquia, industry and credit disbursements also stood out, while in the Central Coffee Region, the agricultural sector complemented the positive performance. Meanwhile, the Caribbean and Llanos Orientales recorded the most modest increases. In these regions, the boost from trade is estimated to have been offset by a decline in agricultural activity, associated with lower agricultural production due to adverse weather conditions. This was compounded by a decline in new housing sales and a contraction in industrial activity.
By activity, most sectors would have posted positive results, except for new housing sales, which deepened their decline (Graph 3). Trade would have grown, driven by sales of technology linked to the FIFA World Cup and the electrified vehicle segment, despite electoral period, which restrained retail sales growth, according to PER surveys. Industrial activity would also have grown, supported by stronger domestic and external demand. Among industrial subsectors, the transportation equipment, food and beverages industries would have posted the strongest growth. In contrast, the textile and apparel sector would have continued to decline due to external competition. In turn, the agricultural sector would have shown a slight expansion, with increases in coffee, sugarcane, and palm production, as well as growth in livestock activity, despite signs of a slowdown. In contrast, banana, citrus, and cocoa production would have declined due to previously recorded excessive rainfall and lower prices. Finally, new housing sales would have continued to decline in both the VIS (social-interest housing) and non-VIS segments.

Archive of the Regional Economic Pulse (available since 2025)
The Regional Economic Pulse indicators and their report are constructed based on surveys to businesspeople and executives who are asked about their perception of the dynamics of their economic activity in the annual comparison and on available statistical information. It is prepared by the Regional Economies Section of the Technical and Economic Information Department of Banco de la República (the Central Bank of Colombia).