Regional Economic Pulse - Third Quarter of 2025
The Regional Economic Pulse indicators and their report are constructed based on surveys to businesspeople and executives who are asked about their perception of the dynamics of their economic activity in the annual comparison and on available statistical information. It is prepared by the Regional Economies Section of the Technical and Economic Information Department of Banco de la República (the Central Bank of Colombia). The content is solely the responsibility of the authors and does not commit Banco de la República or its Board of Directors.
During the third quarter of 2025, all regional economies likely recorded annual growth. Antioquia remained the most dynamic, surpassing its performance in the previous quarter. Bogotá and the Southwest, Northeast, and Central Coffee regions ostensibly accelerated their growth rates driven by trade and industry.
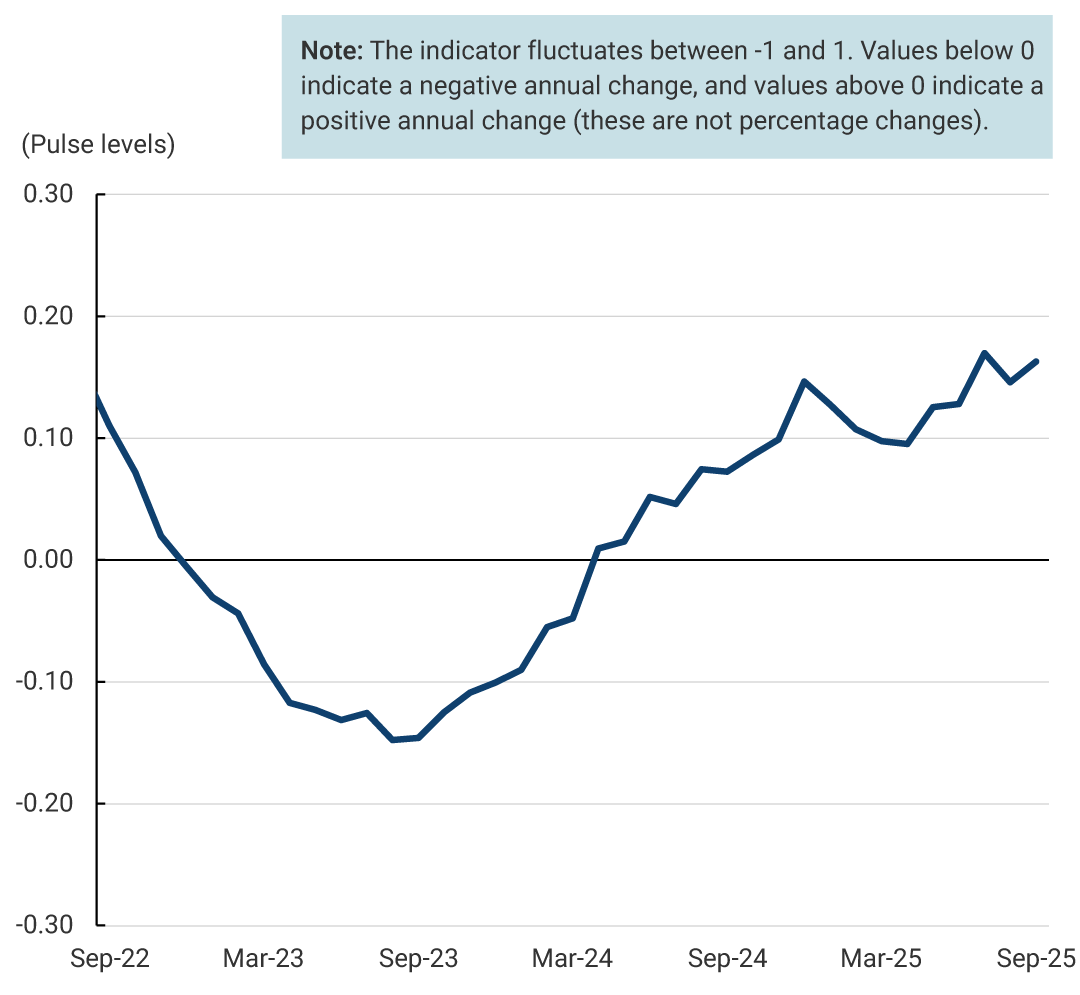
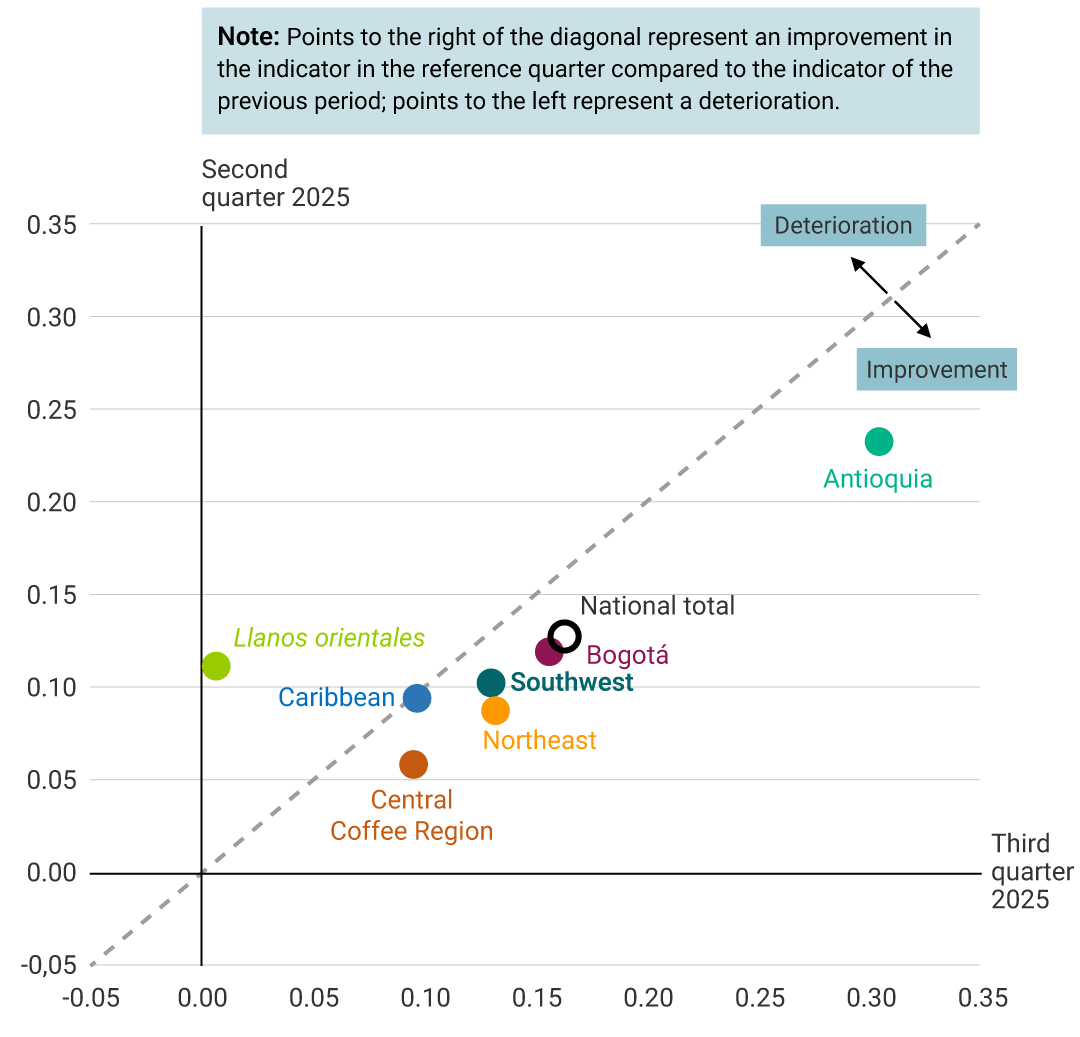
The Regional Economic Pulse (Pulso Económico Regional, PER in Spanish) indicator suggested that the national economy experienced annual growth during the third quarter of 2025 (Graph 1). This aggregate result could be attributed to the positive performance of all regional economies, with Antioquia standing out for a higher annual variation than the rest of the country, which would have exceeded the increase observed in the second quarter (Graph 2).
Most regions exhibited stronger increases than in the previous quarter. In the case of Antioquia, growth could be linked to the dynamism of domestic consumption, which would have driven progress in all monitored activities, according to the perceptions of the region’s business leaders. This same consumption-driven momentum likely supported the performance of the Southwest, the Northeast, the Central Coffee Region, and Bogotá, reflected in higher domestic trade sales, an increase in industrial production, and greater credit disbursements. Meanwhile, the indicator for the Caribbean region remained positive, explained by the performance of trade and manufacturing, despite a decline in agricultural activity caused by phytosanitary issues that affected some crops. In contrast, the Llanos Orientales seemingly recorded the lowest growth due to the impact of the rainy season on agricultural and industrial output, in addition to the rice growers’ strike in July and the closure of the road to the Llanos caused by landslides.
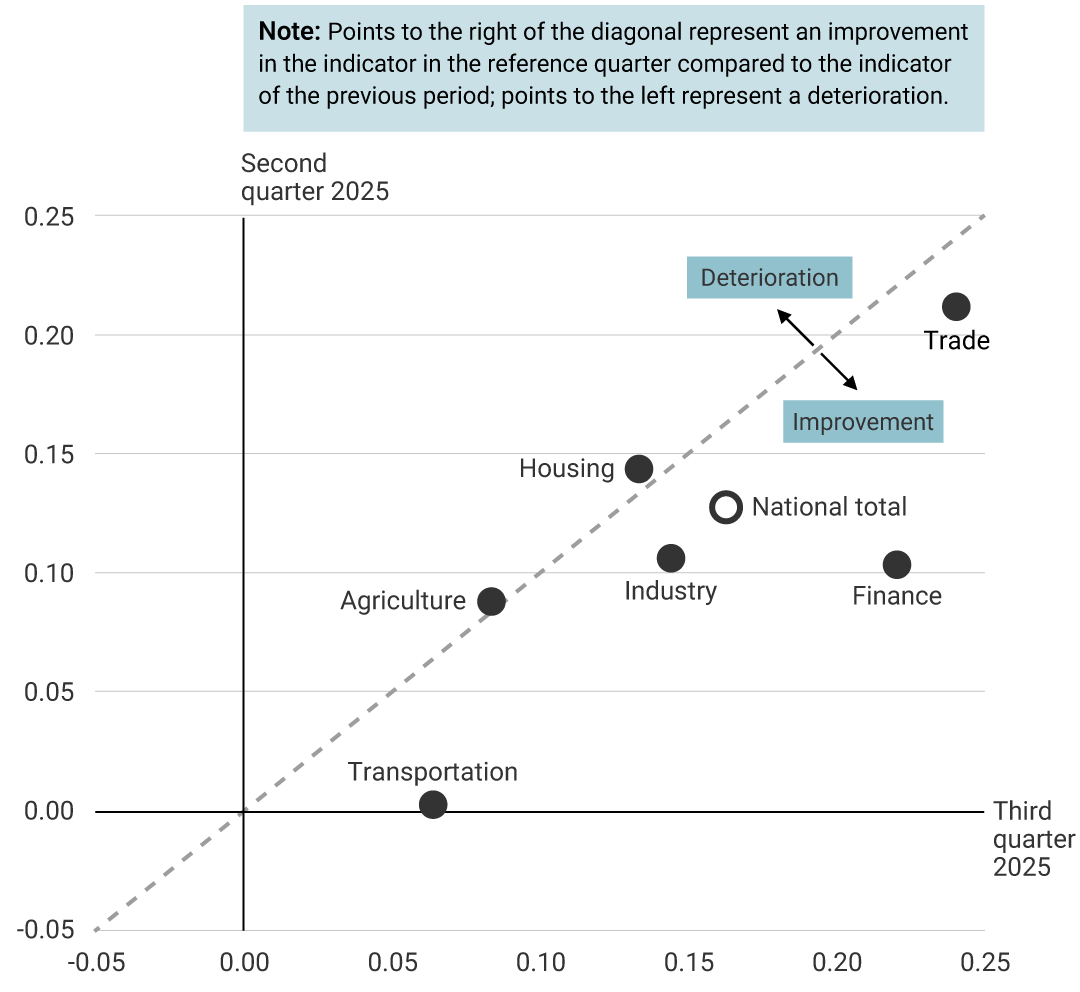
By economic activity, trade recorded the highest growth (Graph 3). Sales would have been driven by promotional campaigns, greater access to credit, and the dynamism of domestic tourism, according to the perceptions gathered. Among product categories, durable goods such as technology, home appliances, vehicles, and motorcycles would have registered the highest increases, along with clothing. In turn, the hotel industry would have shown an increase associated with events held, although its pace would remain moderate due to users' preference for alternative accommodation options. Industry maintained its upward trend supported by the increase in demand, the acquisition of new clients, and operational improvements. Results for manufacturing of food, chemicals, and motorcycles stood out. In the agricultural sector, production likely increased thanks to favorable weather conditions across several regions. Finally, new housing sales have seemingly grown, stimulated by the availability of local subsidies and the reduction in interest rates.
Archive of the Regional Economic Pulse (available since 2025)
The Regional Economic Pulse indicators and their report are constructed based on surveys to businesspeople and executives who are asked about their perception of the dynamics of their economic activity in the annual comparison and on available statistical information. It is prepared by the Regional Economies Section of the Technical and Economic Information Department of Banco de la República (the Central Bank of Colombia).