Regional Economic Pulse - Fourth Quarter of 2025
The Regional Economic Pulse indicators and their report are constructed based on surveys to businesspeople and executives who are asked about their perception of the dynamics of their economic activity in the annual comparison and on available statistical information. It is prepared by the Regional Economies Section of the Technical and Economic Information Department of Banco de la República (the Central Bank of Colombia). The content is solely the responsibility of the authors and does not commit Banco de la República or its Board of Directors.
In the fourth quarter of 2025, most regional economies likely recorded annual growth, although at a slower pace than in the previous quarter. Antioquia would have remained the region with the greatest expansion, while the Northeast was the only area to increase its annual growth relative to the third quarter. The performance of both regions would have been driven by trade and industry dynamics. Meanwhile, Bogotá, the Southwest, the Central Coffee Region, and the Llanos Orientales likely experienced slower growth rates, given the weak performance of the industry.
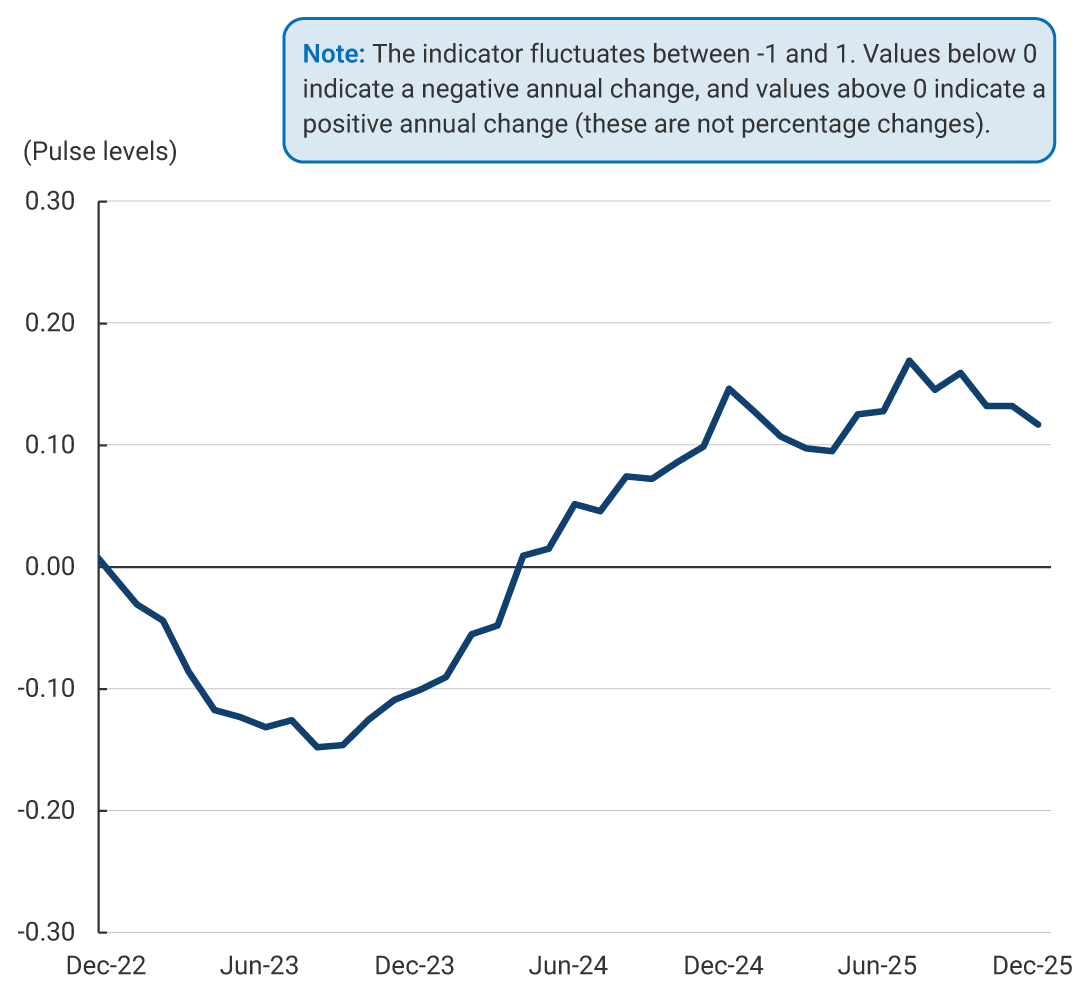
According to the Regional Economic Pulse (Pulso Económico Regional, PER in Spanish) indicator, the national economy seemingly expanded in annual terms during the fourth quarter of 2025, albeit at a slower pace than in the third quarter (Graph 1). The annual growth in regional economies was mainly supported by trade, while the slowdown would reflect the weaker momentum in industry and agriculture.
Rolling Quarter Average
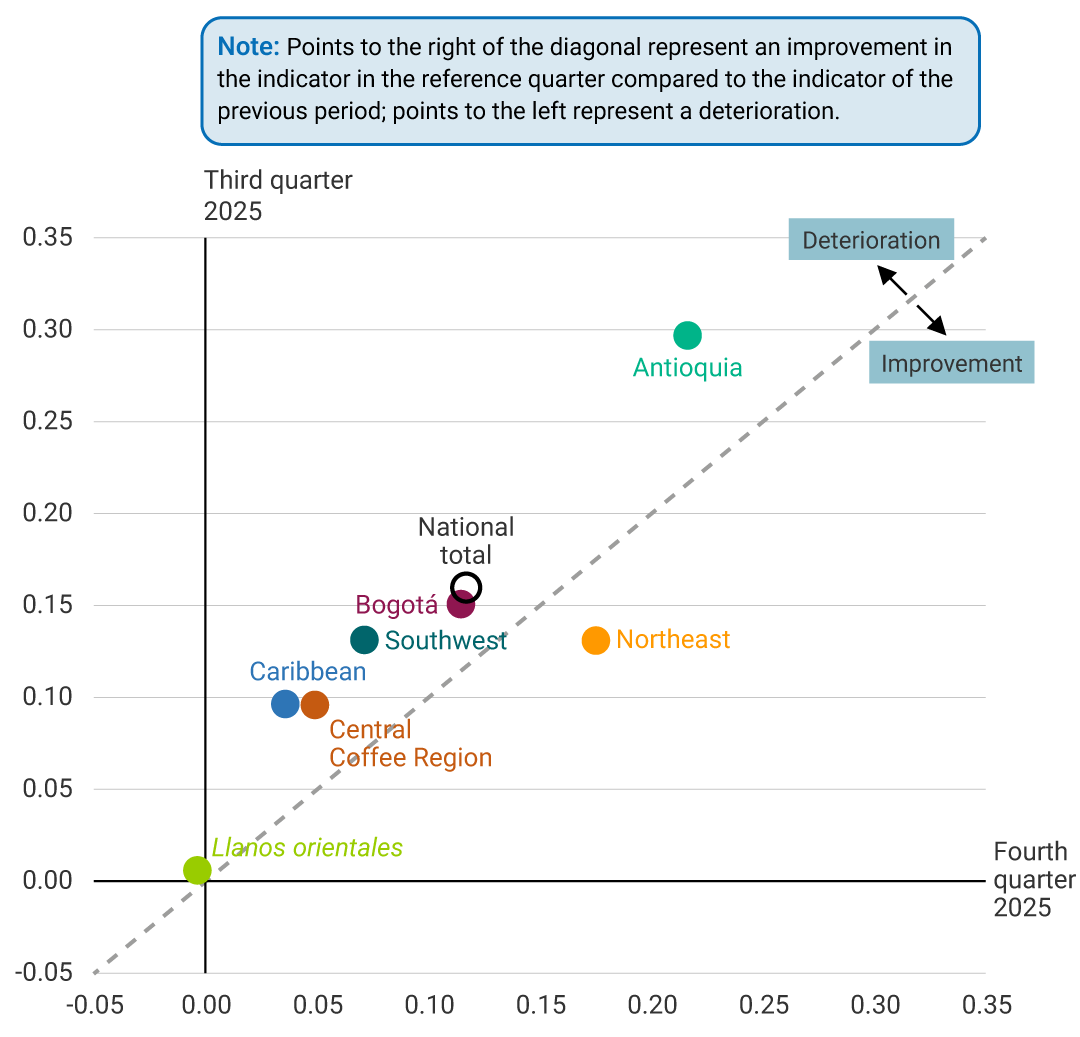
In most regions, the businesspeople surveyed reported an increase in their activity, although more moderate than in the previous quarter (Graph 2). Antioquia would continue to stand out due to growth associated with the performance of trade, credit disbursements, and the industry; however, the decline in coffee production reduced the region’s dynamics compared to the third quarter. In contrast, the Northeast outperformed the results from the previous quarter, supported by the performance of industry and trade. Bogotá, the Central Coffee Region, the Southwest, and the Caribbean likely decelerated due to the weak performance in the industry. According to sources, this outcome was associated with the temporary shutdowns of manufacturing plants for maintenance. Even so, growth in these regions would be explained by the positive performance of the trade and financial sector, supported by competitive interest rates and increased consumption, particularly of durable goods. In turn, the Llanos Orientales would have remained unchanged in annual terms, with declines in agro-industrial activity due to supply chain disruptions and adverse weather conditions, offset by an increase in retail trade.
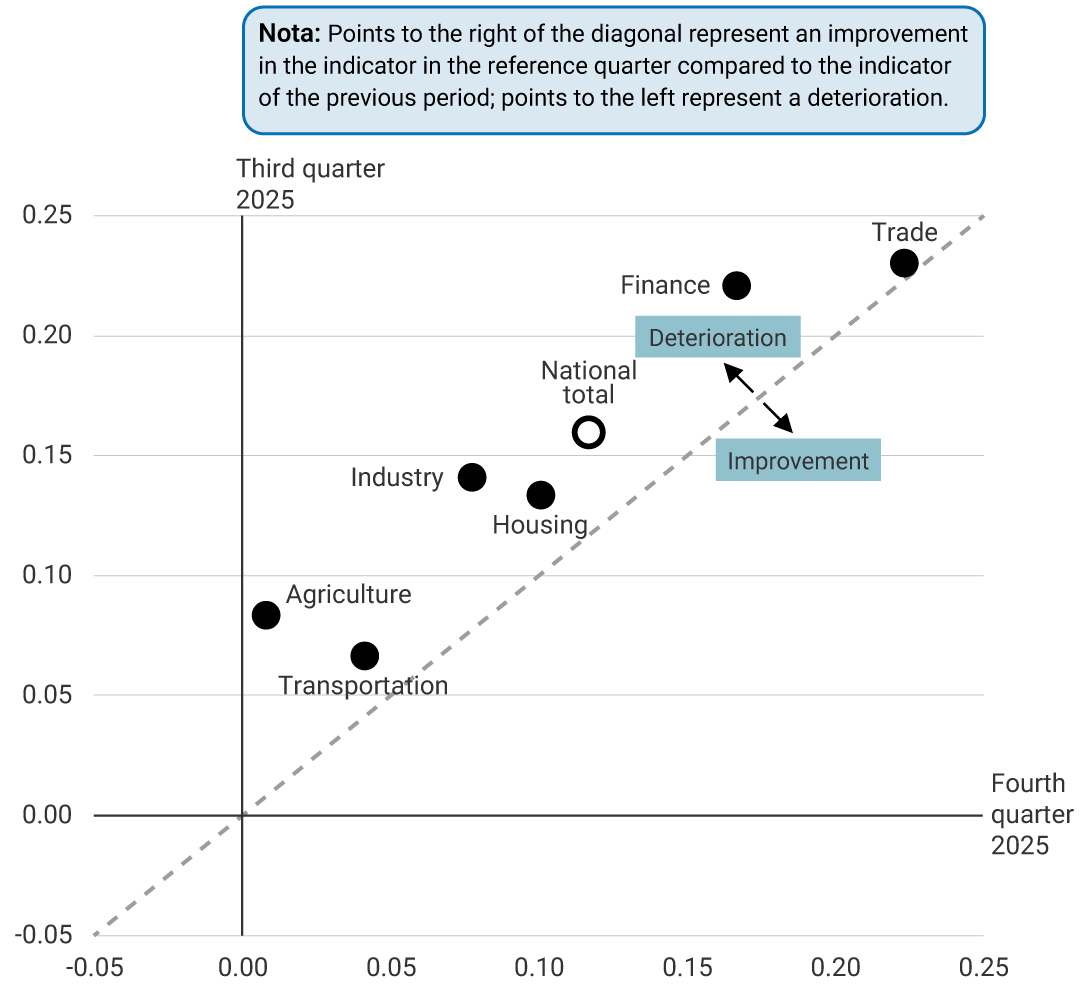
By activity, trade likely remained the sector with the highest increase (Graph 3), driven by longer promotional campaigns than those in the fourth quarter of 2024 and the opening of new stores, in accordance with the perceptions obtained. The sale of vehicles and motorcycles seemingly maintained a historically high growth, supported by new models and improved financing conditions; however, it advanced at a slower pace than in the third quarter of 2025. Credit in the financial system would have increased due to lower interest rates and commercial strategies; however, more restrictive lending policies were applied in some cases. According to sources, the industry would have grown due to a higher amount of orders, operational improvements, and new clients. At the same time, its pace moderated due to maintenance and lower availability of agricultural raw materials, which affected the production of certain foods. The agricultural sector likely grew, but at a slower pace than in the previous quarter. Agricultural and livestock activities would have benefited from the stronger demand for protein and increased rainfall, which improved pasture conditions, resulting in higher milk collection. In contrast, agricultural production declined due to rainfall and delays in planting and harvesting. Housing dynamics weakened as a result of lower Low-Income Housing (LIH) sales.
Archive of the Regional Economic Pulse (available since 2025)
The Regional Economic Pulse indicators and their report are constructed based on surveys to businesspeople and executives who are asked about their perception of the dynamics of their economic activity in the annual comparison and on available statistical information. It is prepared by the Regional Economies Section of the Technical and Economic Information Department of Banco de la República (the Central Bank of Colombia).