Regional Economic Pulse - First Quarter of 2026
The Regional Economic Pulse indicators and their report are constructed based on surveys to businesspeople and executives who are asked about their perception of the dynamics of their economic activity in the annual comparison and on available statistical information. It is prepared by the Regional Economies Section of the Technical and Economic Information Department of Banco de la República (the Central Bank of Colombia). The content is solely the responsibility of the authors and does not commit Banco de la República or its Board of Directors.
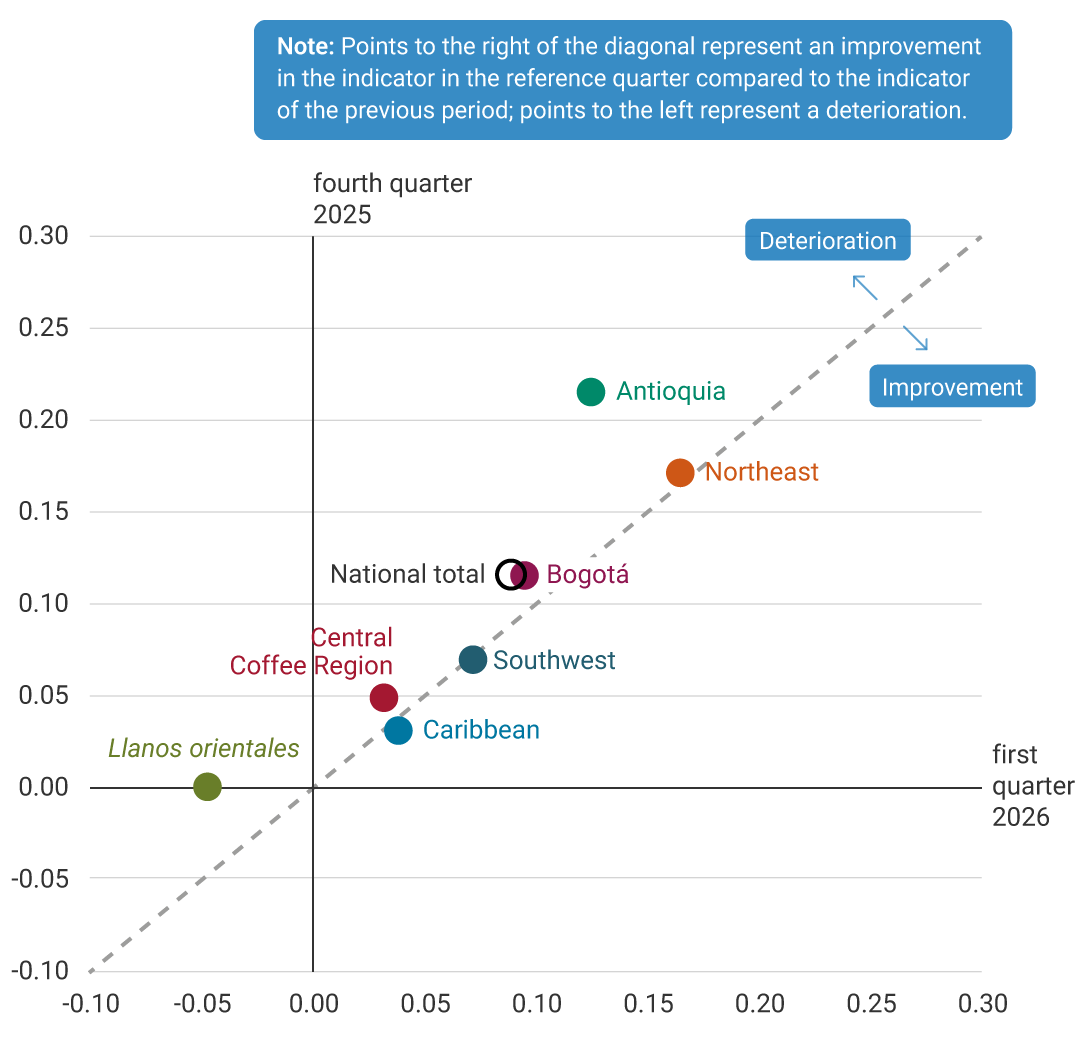
In the first quarter of 2026, regional economies likely recorded year-on-year growth, the Llanos Orientales, which declined, according to the perceptions gathered. The Northeast led growth, showing sustained expansion, followed by Antioquia, which grew at a slower pace than in the fourth quarter of 2025. The dynamics of industry and trade, particularly the automotive segment, likely drove these economies, as well as those of Bogotá and the Southwest. By contrast, the Caribbean and Central Coffee regions experienced more moderate growth, associated with the weak performance of agricultural activity, which largely explained the negative outcome of the Llanos Orientales.
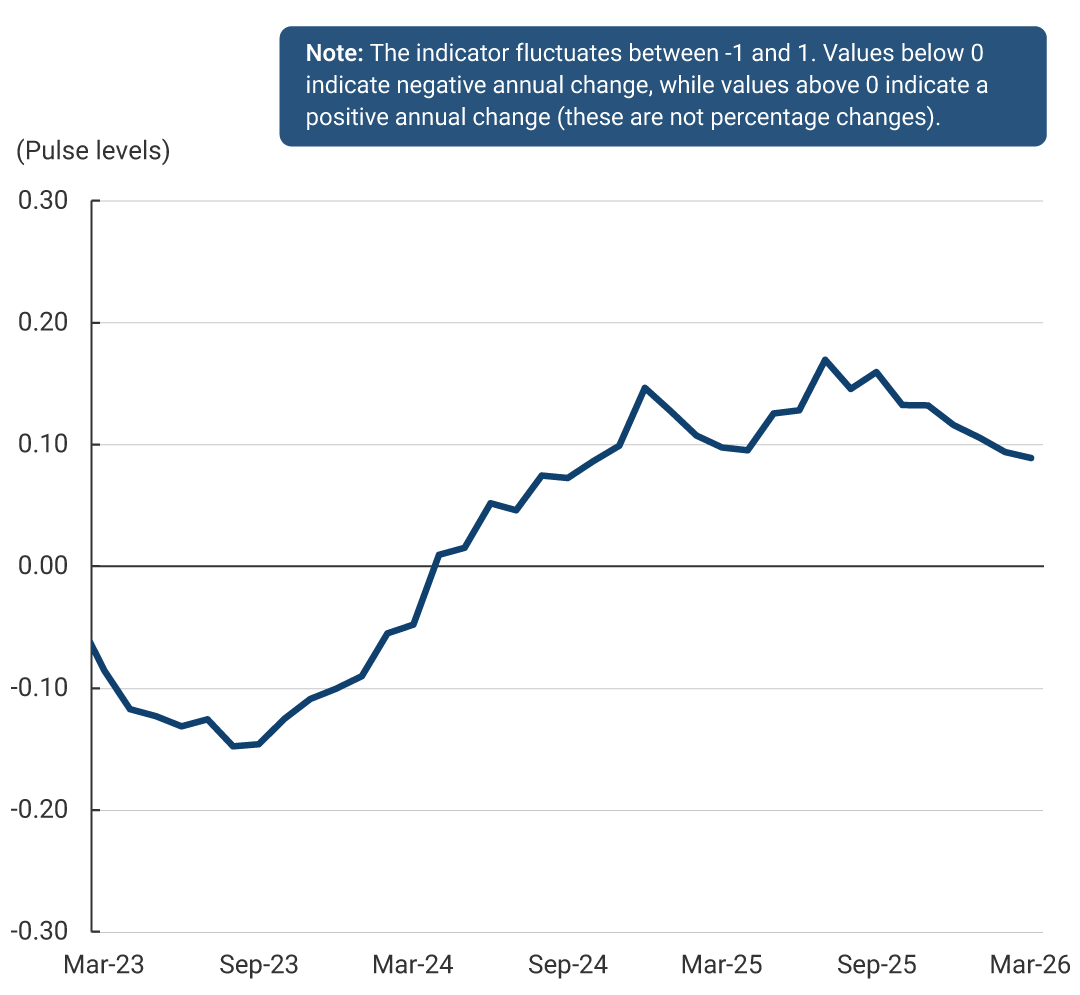
According to the Regional Economic Pulse (PER, by its Spanish acronym) indicator, the national economy would have slowed its growth rate during the first quarter of 2026 (Graph 1). Most regional economies continued expanding, supported by positive trade performance. However, this increase may have been dampened by caution and widespread uncertainty, which restrained household spending, as well as by weak agricultural output, based on the perceptions gathered.
Rolling Quarter Average
Economic activity in most regions likely grew, albeit at a slower pace compared with the end of 2025 (Graph 2). The strongest expansions, above the national total, were recorded in the Northeast, Antioquia, and Bogotá, supported by the positive performance of industry, trade, and credit disbursements. Within the trade sector, demand for vehicles stood out, particularly for electric models in Bogotá. These same sectors would also have underpinned positive outcomes in the Southwest and Caribbean regions, where household spending dynamics, as well as domestic and external demand for industrial goods, contributed to growth. However, in the Caribbean and Central Coffee Region, the pace of expansion was constrained by a contraction in agricultural activity, affected by the prolonged rainy season, according to the surveys conducted. In the Llanos Orientales, the decline in the agricultural activity, together to weaker housing sales and industrial performance, would have weighed on economic performance, making it the only region to post a year-on-year contraction during the period analyzed.
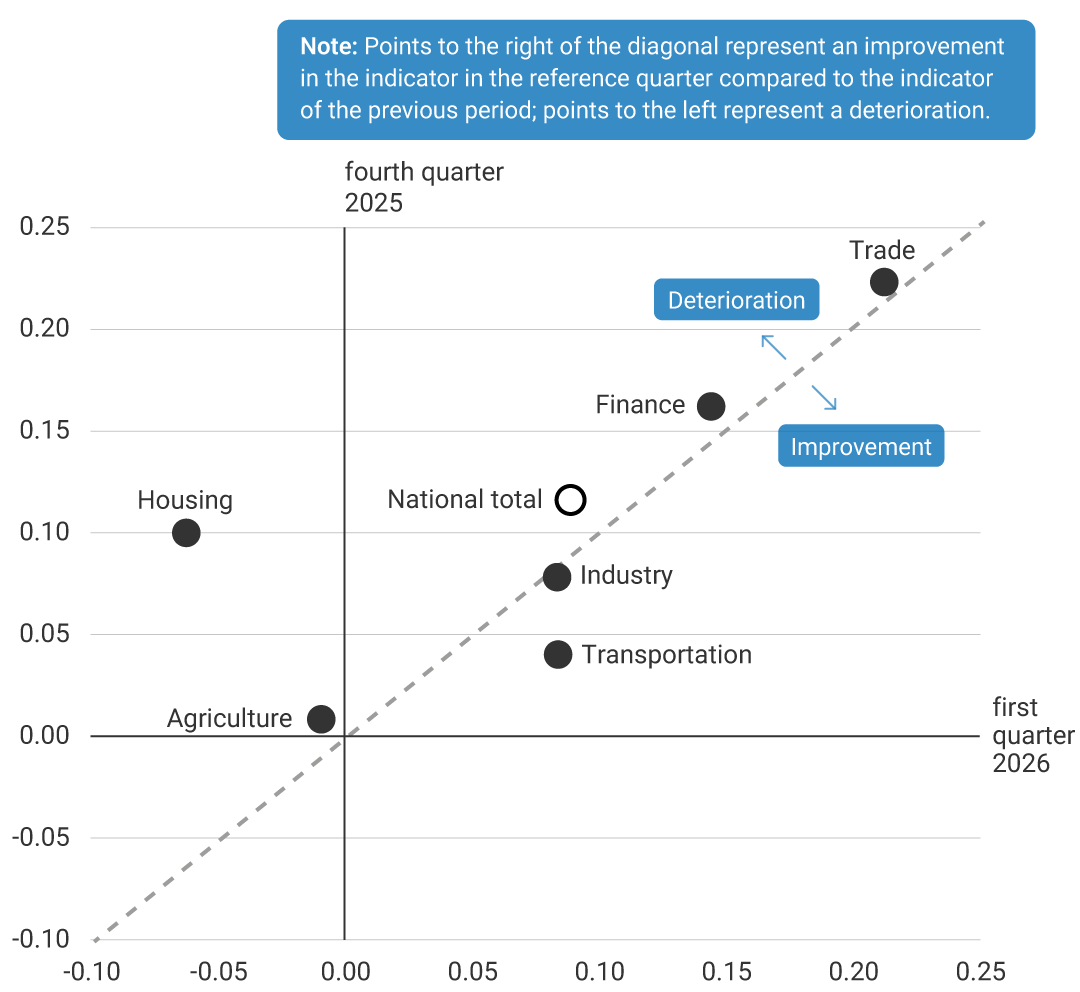
By activity, trade would have remained the strongest expansion, although with a slight slowdown (Graph 3). This outcome occurred in a context of political and economic uncertainty, prompting greater caution in household consumption, according to the perceptions gathered. Financial system credit also grew, but at a more moderate pace, reflecting prudence on both the demand and supply sides of lending. Industrial activity posted growth similar to the previous quarter, a performance that would be associated with higher demand, inventory replenishment, improvements in operational efficiency, and greater availability of raw materials. However, the sector likely faced pressure from higher costs and uncertainty linked to the increase in the minimum wage. Transportation was the only activity to show an improvement in performance compared with the fourth quarter of 2025, driven by the air transport segment. In contrast, agricultural activity continued to post negative variations, explained by reduced production of certain crops such as coffee, banana, plantains, and avocado, affected by heavy rainfall, flooding, and reduced profitability in previous periods. Livestock activity, by comparison, exhibited moderate growth, supported by favorable rainfall for pastures and higher consumption. New housing sales would have continued to show limited dynamism.
Archive of the Regional Economic Pulse (available since 2025)
The Regional Economic Pulse indicators and their report are constructed based on surveys to businesspeople and executives who are asked about their perception of the dynamics of their economic activity in the annual comparison and on available statistical information. It is prepared by the Regional Economies Section of the Technical and Economic Information Department of Banco de la República (the Central Bank of Colombia).