As usual, we devote the last Blog of the year to provide a preliminary assessment of the performance of the Colombian economy over the year about to end, as well as to examine its outlook. In keeping with its commitment to transparency, Banco de la República (the Central Bank of Colombia, BanRep) publishes these analyses in the Monetary Policy Report and the Report of the Board of Directors to the Congress of Colombia, which are complemented by other institutional publications1.
(series seasonally adjusted and corrected for calendar effects)
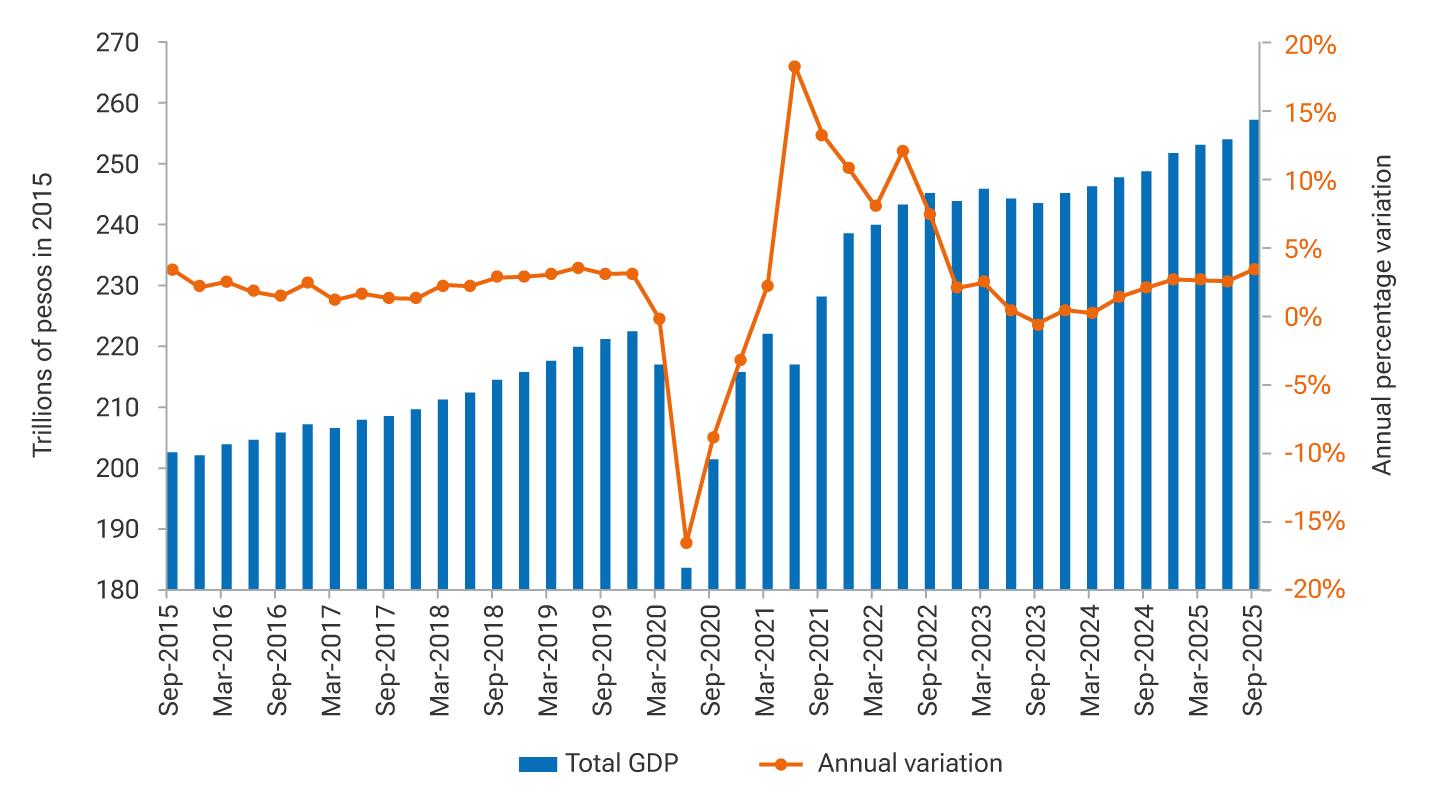
During 2025, the growth of the economy’s gross domestic product (GDP) accelerated (Graph 1). After recording a 1.6% growth in 2024 —compared to 0.7% in 2023—, annual GDP growth in the first three quarters of 2025 has continued to increase, reaching 2.7%, 2.5%, and 3.4%, respectively, according to calculations seasonally adjusted and corrected for calendar effects. This progressive dynamism has been driven by the strengthening of domestic demand, whose quarterly growth has been above 4.0% year-on-year throughout the year, and reached 5.0% in the quarter ended in September, surpassing the projections of the technical staff. The dynamism of household consumption, particularly in its durable and semi-durable goods component, has been a key contributor to the increase in demand. Similarly, the dynamism of public consumption has also been increasing, expanding at a 15.2% rate in the third quarter. Likewise, gross fixed capital formation rebounded, recording a 4.7% growth in the third quarter, driven by machinery and equipment, as well as civil works. This increase in domestic demand over the course of the year has been met to a significant extent by higher imports, which have grown by more than 10% year-on-year. This figure exceeds the increase in exports and has resulted in a widening of the trade balance deficit.
On the supply side, the tertiary sector, which comprises service branches, has shown the strongest dynamism, driven by the good performance of artistic and entertainment activities, commerce, transportation and accommodation, public administration services, and financial and insurance activities. The primary sector has exhibited a mixed performance, with a robust growth in the crop and livestock sector, offset by a significant contraction in the mining and quarrying sector. The secondary sector has shown a weak performance due to the contraction in construction, given the weak dynamics in the buildings segment, which has been partially offset by growth in civil works. In turn, manufacturing, which is part of this sector, has achieved a gradual recovery, reaching a 4.3% growth in the quarter ended in September. Taking all of the above into account, the technical staff estimates a GDP growth of 2.9% for 2025, exceeding the figure observed in 2024.
Reflecting the growing pace of economic activity, the labor market has exhibited strong dynamism so far in 2025, with the employed population increasing and unemployment falling to historical lows. Indeed, by the end of October, the unemployment rate stood at 8.8% for the national aggregate and at 8.5% for urban areas, based on the seasonally adjusted series. It is worth noting that job creation in recent months has been led by the segment of salaried workers, which has contributed to a decline in the informality rate.
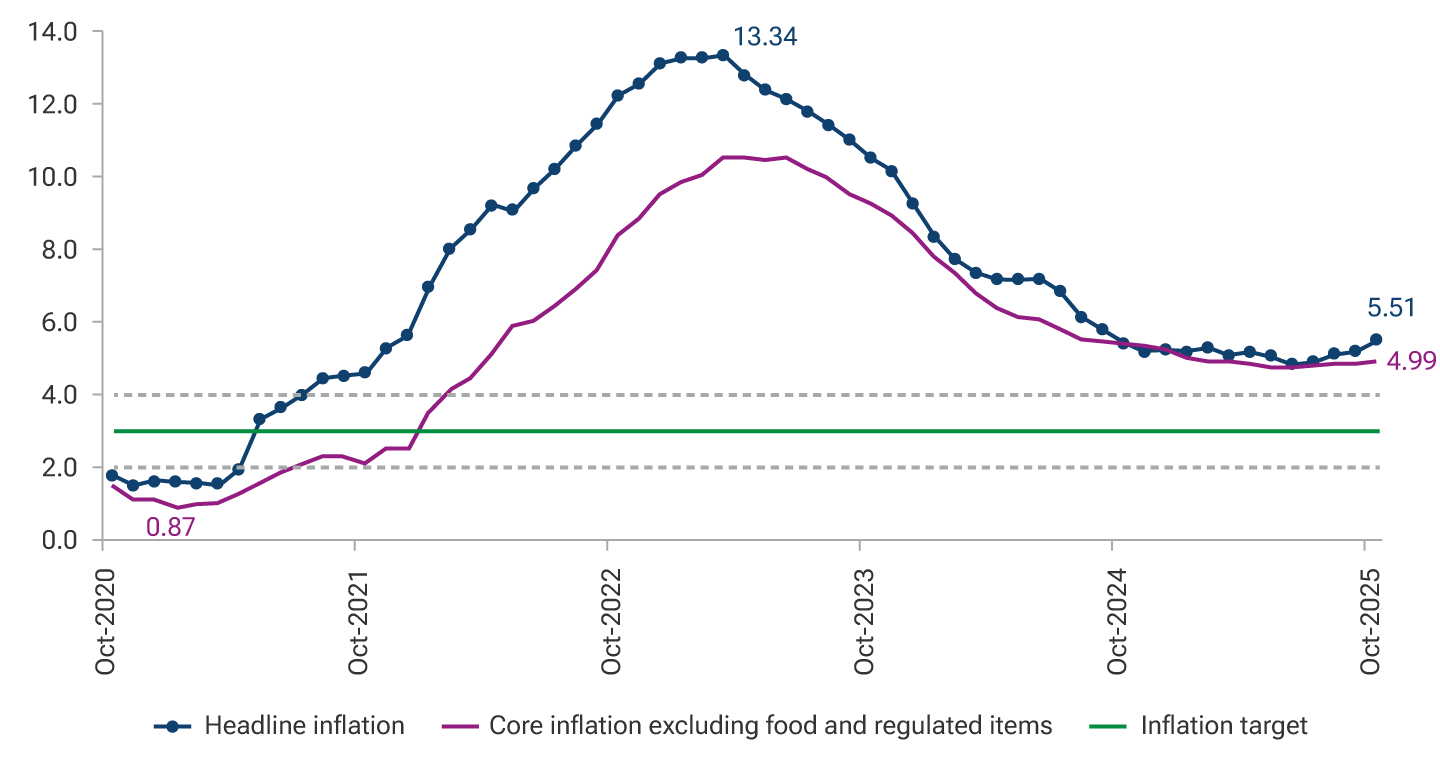
The performance of inflation so far in 2025 contrasts significantly with that observed in the previous year (Graph 2). While inflation declined from 9.3% at the end of 2023 to 5.2% at the end of 2024, it interrupted its downward trend in the first half of 2025 and, at the beginning of the second half of the year, it shifted to an upward trend, increasing from 4.8% in June to 5.5% in October. This trend was interrupted in November when inflation stood at 5.3%. This rebound occurred despite a monetary policy that has remained contractionary, but which has faced significant growth in domestic demand, driven by higher private and public spending. In addition, a growing process of price indexation has emerged, supported by rising inflation expectations and by minimum wage increases in percentages that have substantially exceeded observed inflation in recent years. This raises the nominal reference used by the market to adjust a wide range of prices across the economy, particularly those of labor force-intensive goods and services.
Most items of the consumer’s basket account for the initial rigidity of the annual inflation rate and its recent increases. First, food inflation at the end of October had doubled relative to that recorded in December 2024, rising from 3.3% to 6.6%, although it reversed to 5.7% in November. Second, although inflation on regulated items declined from 7.3% to 6.3% over the same period, it remains at a level that is twice the inflation target, due to high gas and energy fees, among other factors. On the other hand, the measure of core inflation excluding food and regulated items showed a marginal decline between the end of 2024 and June 2025, falling from 5.2% to 4.8%. Beginning in July, this measure started to rise, although it has remained close to 4.8%. The figures for both headline inflation and core inflation have exceeded the projections of BanRep’s technical staff, and their performance suggests that inflation in 2025 has been pressured upwards both by supply shocks, as is the case with food and certain regulated items, and demand pressures, as indicated by the recent increase in core inflation excluding food and regulated items.
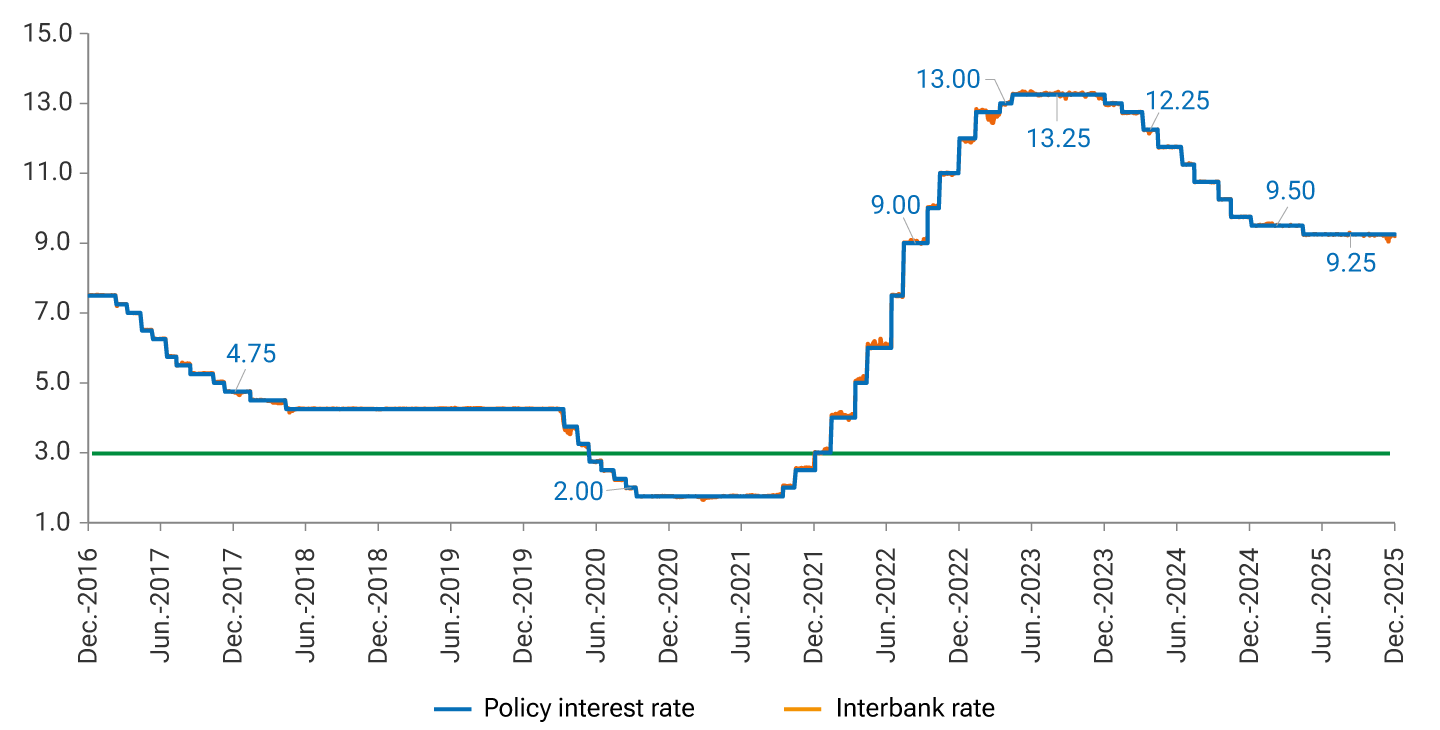
The evolution of inflation and its expectations throughout 2025 have not provided appropriate conditions to continue the process of reducing the policy interest rate carried out in 2024 (Graph 3). The only cut to the policy interest rate in 2025 was implemented at the late-April session of the Board of Directors, when it went from 9.5% to 9.25%. The Board has emphasized that the increase in headline inflation and the inflexibility of core inflation excluding food and regulated items reveal signs of price indexation and the strength of domestic demand, which need to be addressed through a contractionary monetary policy stance. This situation could be exacerbated if the minimum wage increase in 2026 once again substantially exceeds observed inflation and productivity. Also, the potential emergence of exchange rate pressures is not ruled out, associated with changes in the performance of portfolio capital flows, which have been favorable for the country for most of the year. Additional inflationary risks could also arise from food prices, as well as from some regulated good prices, as happened in 2025. In this context, the technical staff expects that inflation would continue reducing in 2026, but that its full convergence toward the 3.0% target would only occur by the second half of 2027.
1 ↑ Such as the Financial Stability Report and the Labor Market Reports, among others.