National Financial Accounts Bulletin by Institutional Sector – First Quarter 2026

Below is a summary of the financial accounts by institutional sector and financial instrument. For further details, please refer to the Technical Bulletin (only in Spanish).

Publication Date:

Financial Flows for the first quarter of 2026

1. By institutional sector

According to the financial accounts calculated by Banco de la República (the Central Bank of Colombia), in the first quarter of 2026, the current account deficit of the Colombian economy reached 1.2% of quarterly Gross Domestic Product (GDP), compared to 1.7% in the same period in 2025. This is primarily explained by the deficits of non-financial corporations (3.0%) and financial corporations (2.8%). The institutional sectors that partially offset the deficit were the surpluses of households (3.7%) and the General National Government (0.9%).
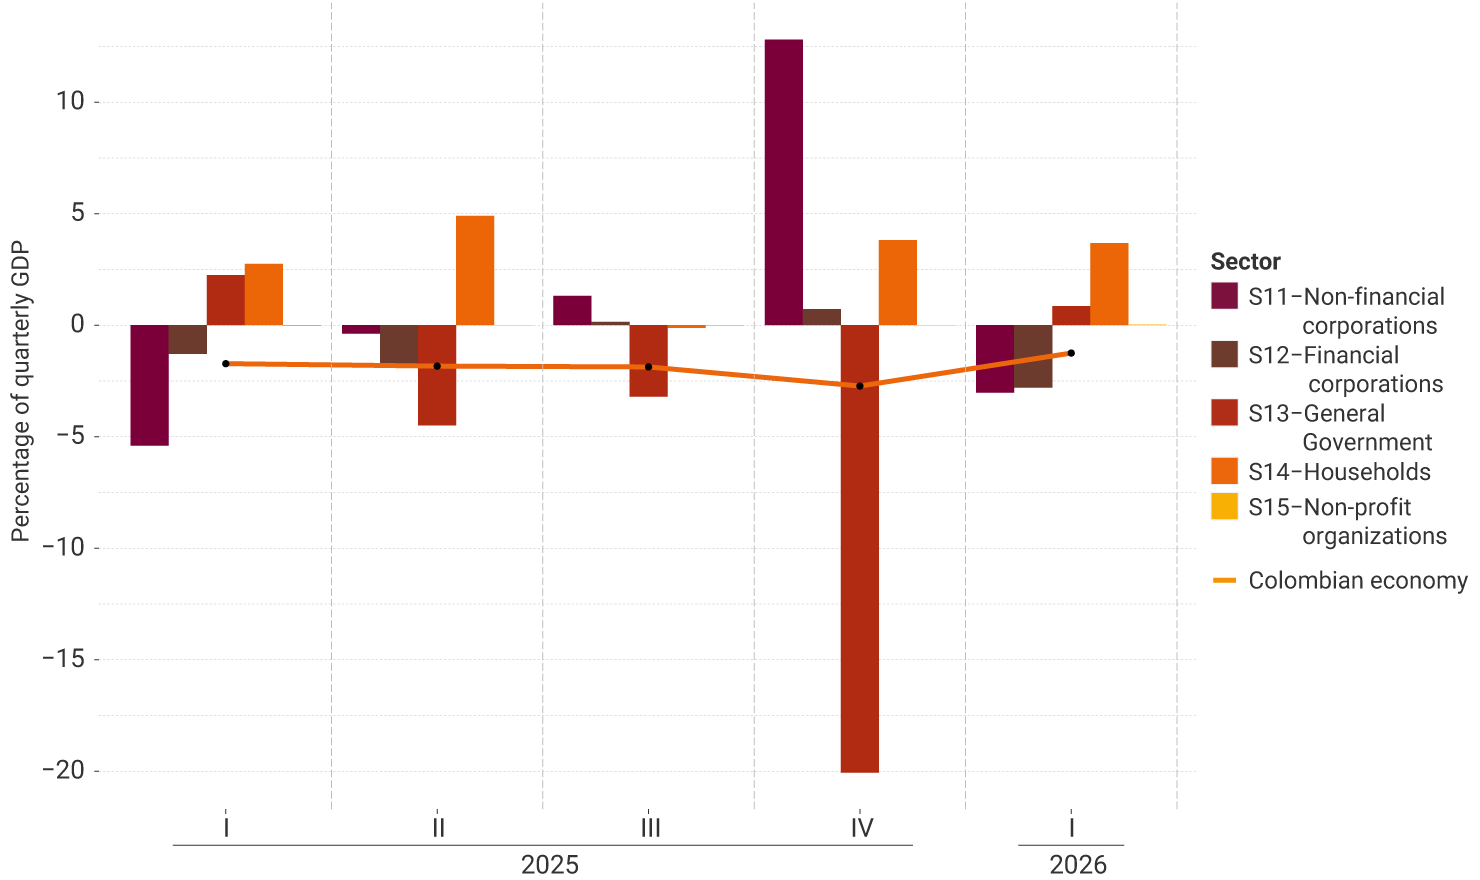
Graph 1. Current Account Deficit of the Colombian Economy and Savings and Investment Balances by Institutional Sector, Q1 2025 – Q1 2026
Bar and line graph with the vertical axis showing percentages of quarterly GDP and the horizontal axis showing quarters I to IV of 2025 and quarter I of 2026. The orange line represents the balance of the Colombian economy, which shows a deficit of close to 2.0% of GDP, with an improvement in the first quarter of 2026 (−1.5%). The bars represent the saving-investment balances of five institutional sectors: households (S14) consistently record positive surpluses, ranging from 2.5% to 5.0% of GDP. General National Government (S13) records deficits in every quarter, with a deficit of 20% of GDP standing out in the fourth quarter of 2025. Non-financial corporations (S11) exhibit volatility, recording a deficit of −5.5% in the first quarter of 2025, a surplus of 13% in the fourth quarter of 2025, and a moderate deficit in the first quarter of 2026. Financial corporations (S12) maintain values close to zero, alternating between small deficits and surpluses. Non-profit institutions (S15) remain in balance throughout the entire period.
Source: Banco de la República - Financial Accounts

Compared to the first quarter of 2025, the economy’s consolidated external financing needs declined by 0.5 percentage points (pp), as reflected in the internal and external financing flows of institutional sectors. Therefore, the reduction in financing was explained by the lower financing needs of non-financial corporations (2.4 pp) and the greater financing capacity of households (1.0 pp). In turn, the financing needs of financial corporations increased (1.5 pp), while the financing capacity of the General National Government declined (1.4 pp).
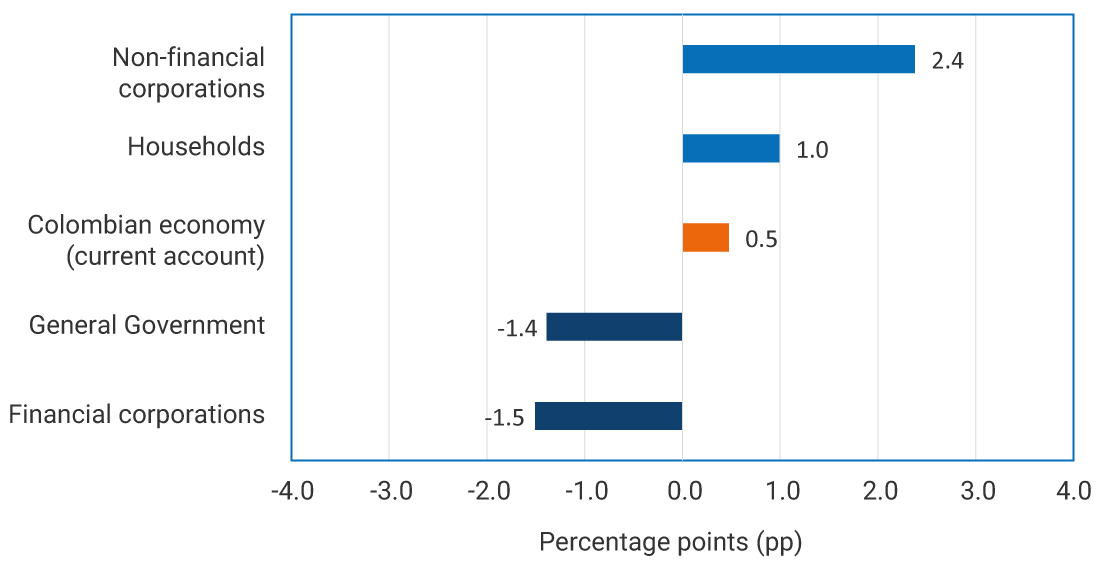
Graph 2. Explanation of the Change in the Colombian Economy’s Saving- Investment Balance by Institutional Sectors, Q1 2025 – Q1 2026
Horizontal bar graph with the horizontal axis showing the contribution to the change, measured in percentage points (pp), with values ranging from −4.0 to 4.0. Non-financial corporations record the largest positive contribution, at 2.4 percentage points. Households contribute 1.0 pp. The Colombian economy (current account) shows an improvement of 0.5 percentage points. By contrast, financial corporations contribute negatively, at −1.5 percentage points, and the General National Government at −1.4 pp.
Source: Banco de la República - Financial Accounts

2. By financial instrument / net external financing

The negative quarterly saving-investment balance of the Colombian economy was covered by net external financing flows equivalent to 1.2% of quarterly GDP. Net inflows of financial resources from the rest of the world were primarily channeled through the issuance of debt securities to the rest of the world (3.1%) and equity investments (0.9%). This was partially offset by deposit outflows to the rest of the world, totaling 2.5% of quarterly GDP.
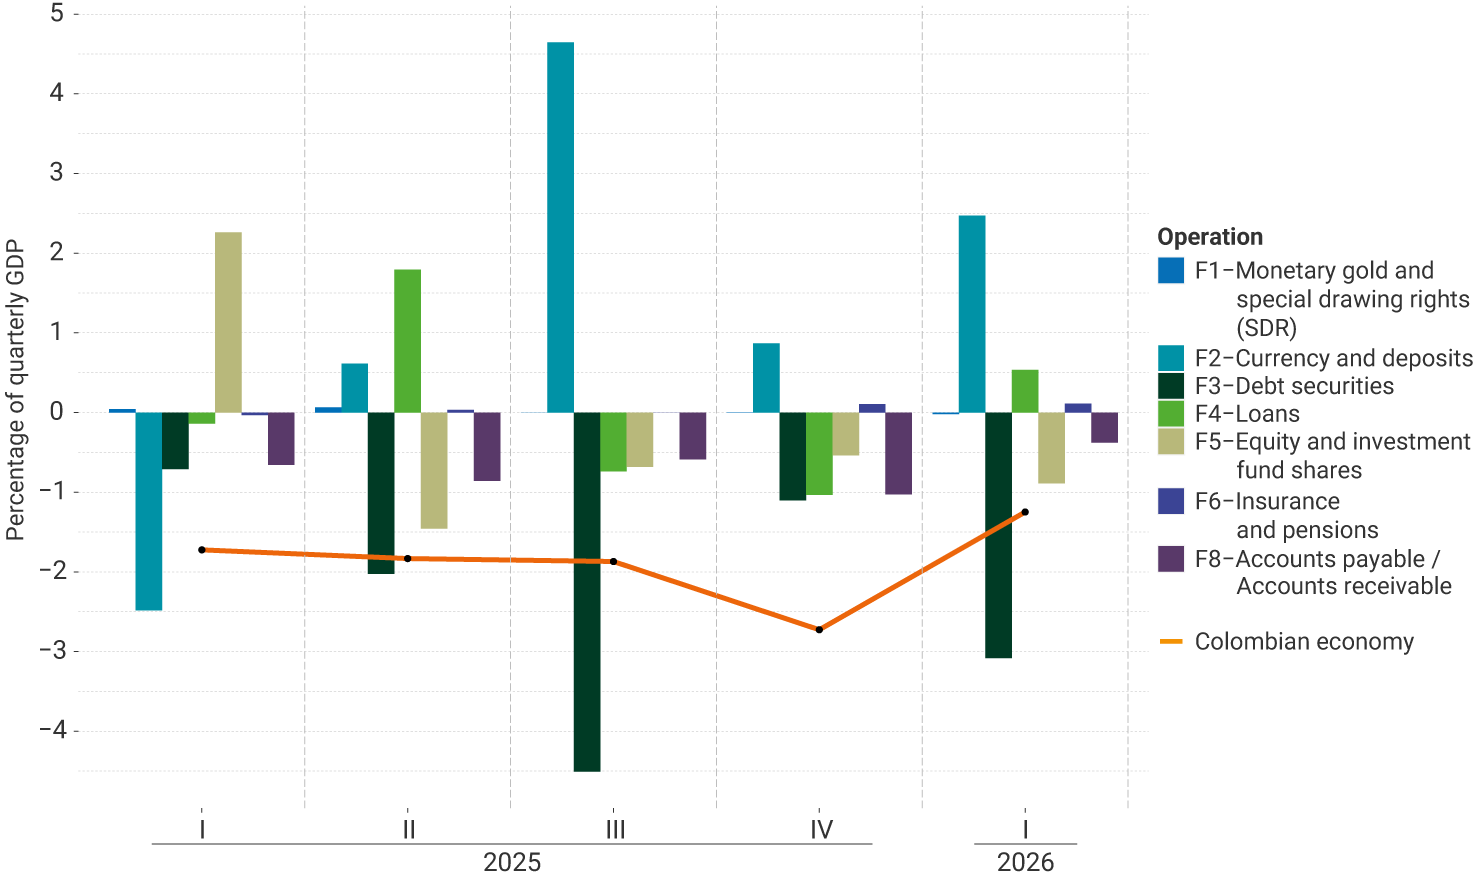
Graph 3. Net External Financing of Colombia’s Saving-Investment Balance by Financial Instrument, Q1 2025 – Q1 2026
Grouped bar and line graph. The vertical axis shows percentages of quarterly GDP, and the horizontal axis shows quarters I to IV of 2025 and quarter I of 2026. The orange line represents the Colombian economy’s balance, which maintained an external deficit close to 2.0% of GDP, with the largest deficit recorded in the fourth quarter of 2025 (−2.8%) and a reduction in the deficit in the first quarter of 2026 (−1.3%). The bars show the contribution of different financial instruments to net external financing: currency and deposits (F2) recorded the largest net inflows of funds, particularly in the third quarter of 2025 (4.6% of GDP) and the first quarter of 2026 (2.5%). Debt securities (F3) recorded the largest net outflows, particularly in the third quarter of 2025 (−4.5%) and the first quarter of 2026 (−3.1%). Loans (F4) showed moderate positive contributions in several quarters, while equity and investment fund shares (F5) alternated between inflows and outflows, with a notable inflow in the first quarter of 2025 (2.2% of GDP). Monetary gold and special drawing rights (F1), insurance, pension, and standardized guarantee schemes (F6), and other accounts payable and receivable (F8) remained relatively stable, with contributions close to zero or of low magnitude.
Source: Banco de la República - Financial Accounts

Compared with the figures for the first quarter of 2025, lower external financing inflows of 0.5 pp were mainly explained by the larger accumulation of deposits abroad (5.0 pp) and higher loan payments (0.7 pp). This was partially offset by the higher equity inflows (3.2 pp) and increased issuance of debt securities in external markets (2.4 pp).
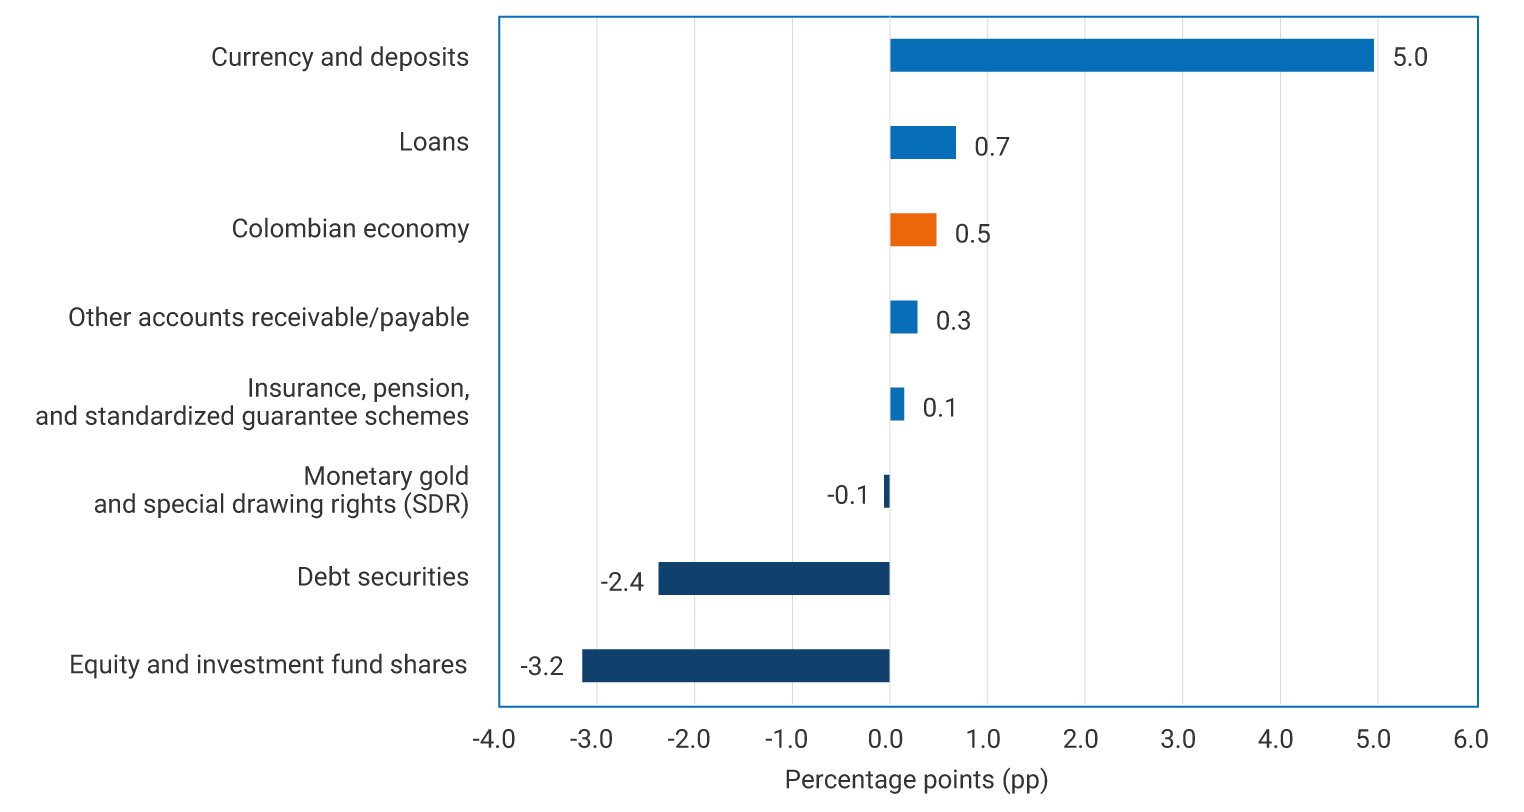
Graph 4. Explanation of the Change in the Financing Needs of the Colombian Economy by Financial Instrument, Q1 2025 – Q1 2026
Horizontal bar graph with the horizontal axis showing contributions measured in percentage points (pp), with values ranging from −4.0 to 6.0. The largest positive contribution corresponds to currency and deposits, at 5.0. This is followed by loans, at 0.7; the Colombian economy, at 0.5; other accounts receivable and payable, at 0.3; and insurance, pension, and standardized guarantee schemes, at 0.1. In turn, monetary gold and special drawing rights record a slightly negative contribution of −0.1. The largest negative contribution comes from equity and investment fund shares, at −3.2, and debt securities, at −2.4.
Source: Banco de la República - Financial Accounts

Financial Account Balances for the first quarter of 2026

1. Net financial position by institutional sector

At the end of the first quarter of 2026, the Colombian economy recorded a net debtor position with the rest of the world equivalent to −46.1% of annual GDP. The sectors with net debtor positions were non-financial corporations (−69.4%) and the General National Government (−46.1%). In contrast, households (63.9%) and financial corporations (5.4%) recorded net creditor positions.

Between the first quarters of 2025 and 2026, the economy’s net external debtor position increased by 2.6 pp, driven by smaller net creditor positions of financial corporations (3.6 pp) and households (3.1 pp), together with a larger net debtor position of the General National Government (2.2 pp). These changes were partially offset by the smaller net debtor position of non-financial corporations (6.3 pp).
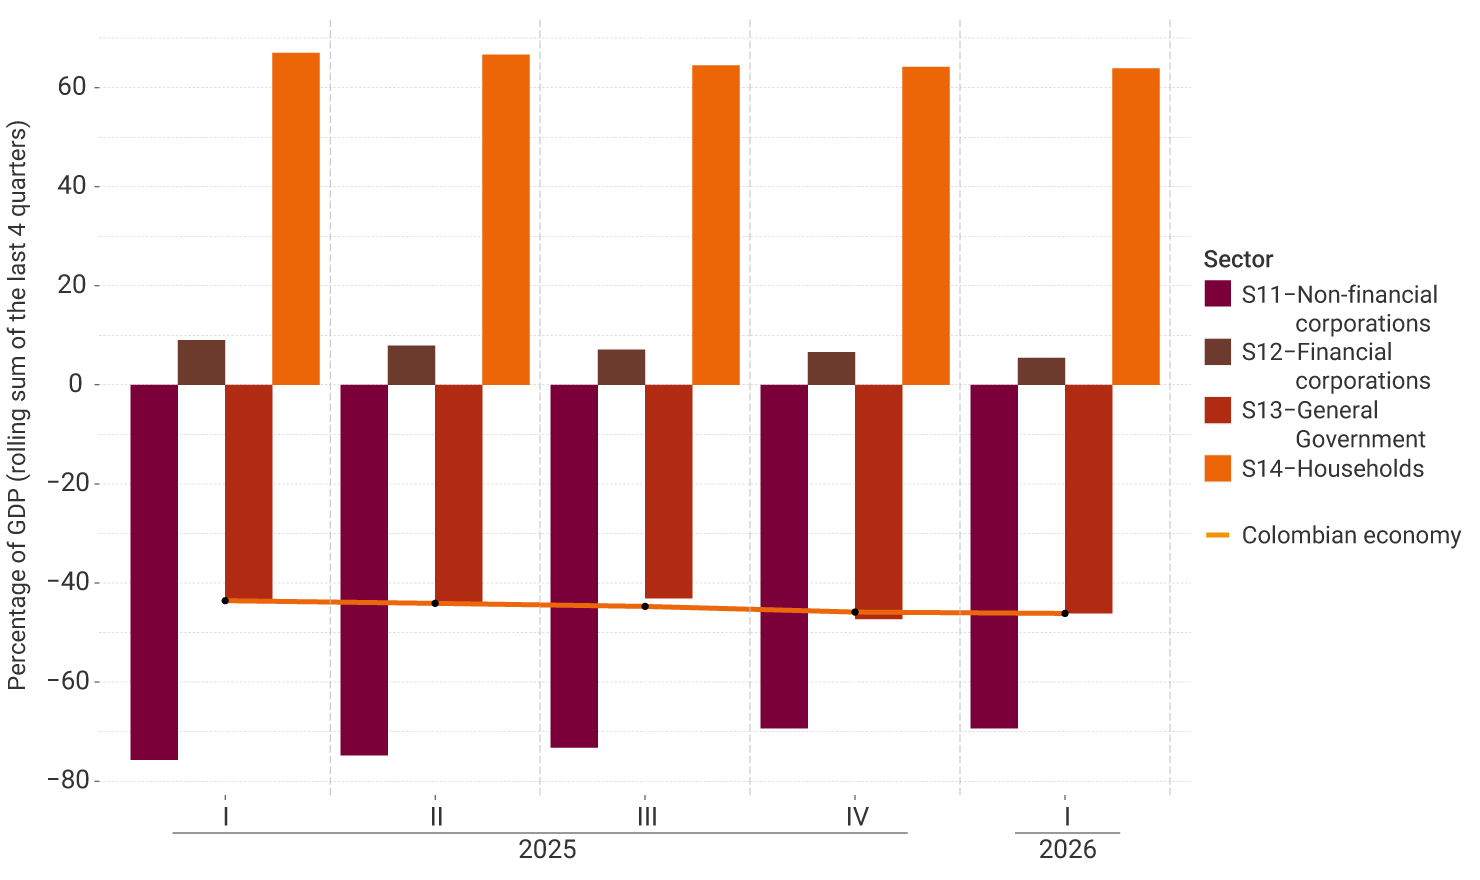
Graph 5. Colombia’s Net Financial Position by Institutional Sector, Q1 2025 – Q1 2026 (percentage of annual nominal GDP*)
* Corresponds to the rolling sum of quarterly GDP for the last 4 periods
Grouped bar and line graph. The vertical axis shows percentages of annual GDP, calculated as the rolling sum of the last four quarters. The horizontal axis shows quarters I to IV of 2025 and quarter I of 2026. The orange line represents the net financial position of the Colombian economy as a whole, which remains in a net debtor position at −46.1%. The bars represent the net financial position of four institutional sectors: households (S14) maintain the largest creditor position, with positive values exceeding 60% of GDP. However, they show a slight decline to around 64% in the first quarter of 2026. Financial corporations (S12) also record a positive net creditor position, which gradually declines from 9.0% to 5.0% of GDP. Non-financial corporations (S11) exhibit the largest net debtor position, with levels close to −76% at the beginning of 2025 and −70% in the first quarter of 2026. General National Government (S13) maintains a relatively stable net debtor position, ranging between −43% and −48% of GDP.
Source: Banco de la República - Financial Accounts

2. Net external position by financial instrument

At the end of the first quarter of 2026, the net debtor position of the Colombian economy with the rest of the world, equivalent to −45.9% of annual GDP, was primarily represented by equity investments (−32.1%), loans (−16.4%), and debt securities (−5.0%). This was partially offset by Colombians’ foreign holdings of deposits (6.3%).

Between the first quarters of 2025 and 2026, the increase of 2.6 pp in the economy’s net debtor position was mainly driven by the growth in equity investments (3.7 pp) and debt securities (2.9 pp). This change was partially offset by a lower debtor position in loans (3.7 pp).
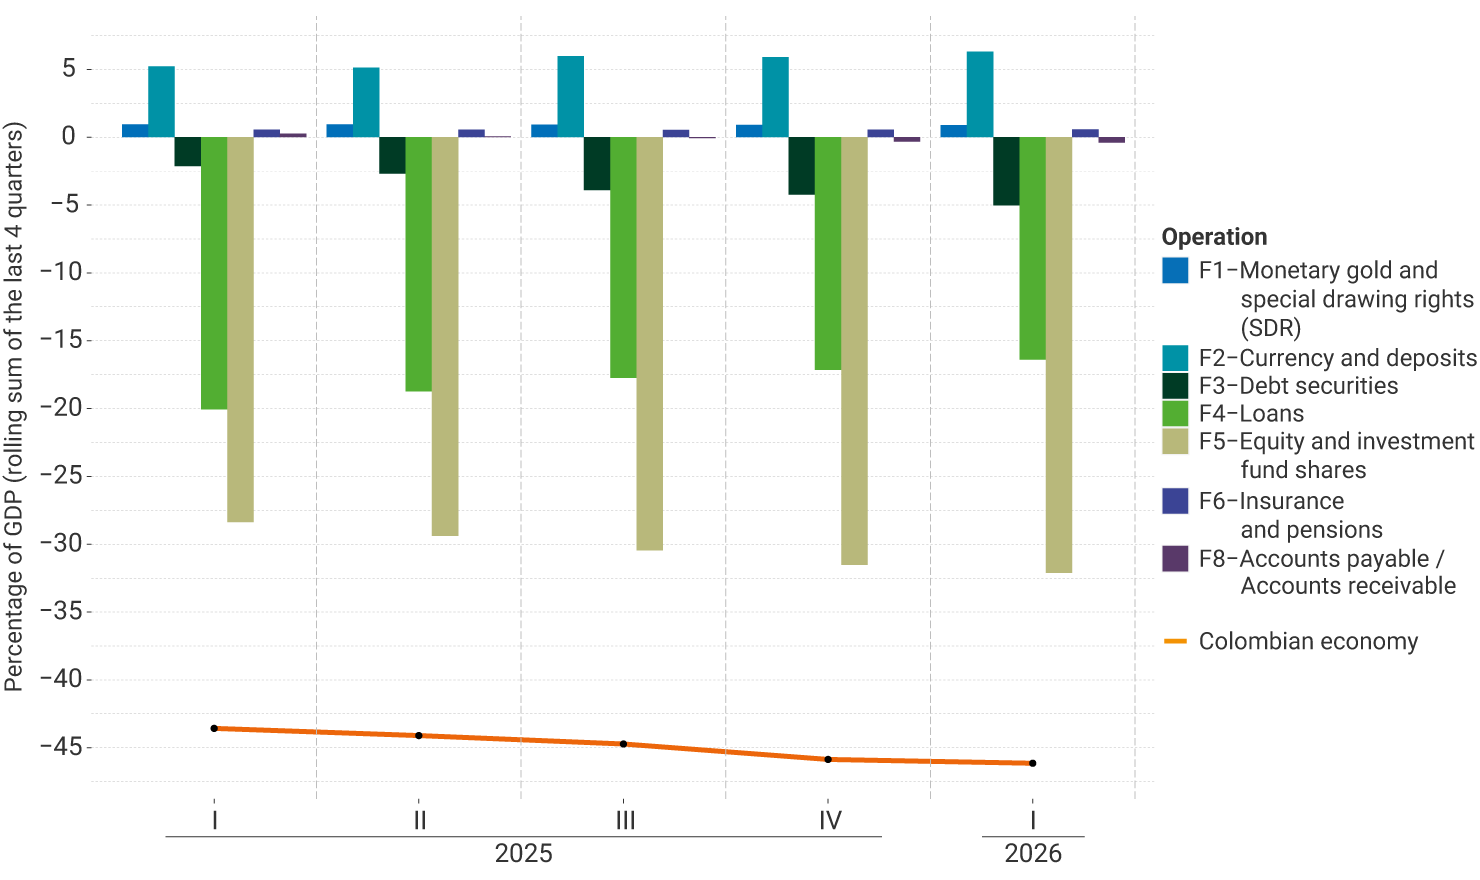
Graph 6. Net External Financial Position of the Colombian Economy by Financial Instrument, Q1 2025 – Q1 2026 (percentage of annual nominal GDP*)
* Corresponds to the rolling sum of quarterly GDP for the last 4 periods
Grouped bar and line graph. The vertical axis shows percentages of annual GDP, calculated as the rolling sum of the last four quarters. The horizontal axis shows quarters I to IV of 2025 and quarter I of 2026. The orange line represents Colombia’s total net external financial position, which remains negative, declining from approximately −44% of GDP in the first quarter of 2025 to about −46% in the first quarter of 2026. The bars show the net external financial position by financial instrument: the largest debtor position corresponds to equity and investment fund shares (F5), with values close to −32% in the first quarter of 2026. Loans (F4) also stand out, although their negative position gradually decreases from around −20% to −17%. Debt securities (F3) show a more moderate debtor position, which increases from −2.0% to −5.0%. By contrast, currency and deposits (F2) maintain a positive and increasing creditor position, rising from 5.0% to 6.0%. Monetary gold and special drawing rights (F1) and insurance, pension, and standardized guarantee schemes (F6) record small positive positions, at approximately 1.0% and 0.5%, respectively, while other accounts receivable/payable (F8) remain close to zero, with only slight variations.
Source: Banco de la República - Financial Accounts

National Financial Accounts Bulletin by Institutional Sector published until now (available since 2024)

Título Fecha de publicación
National Financial Accounts Bulletin by Institutional Sector - First Quarter 2024
National Financial Accounts Bulletin by Institutional Sector - Fourth Quarter 2023
National Financial Accounts Bulletin by Institutional Sector - Third Quarter 2023