Although Colombia’s unemployment rate (UR) has declined in recent years, it remains high in the international context. The most recent Labor Market Report from Banco de la República (the Central Bank of Colombia) includes a comparative analysis of Colombia’s unemployment rate and those of other large Latin American countries and discusses possible explanations for this difference. The analysis was prepared by the Labor Market Analysis Group (GAMLA in Spanish), based on harmonized data from Argentina, Brazil, Chile, Mexico, Peru, and Colombia.
As shown in Graph 1, Colombia’s UR has exhibited a downward trend since 2021. However, this rate remains high compared with other countries in the region. In particular, between the second quarter of 2024 and 2025, which corresponds to the most recent data available for all countries in the sample, Colombia’s UR remained close to 10%, compared with a regional average of 6.5%. The graph also shows that this gap of around 3.5 percentage points has remained quite stable over time and that only in the second quarter of 2025 did it manage to match Chile’s UR.
The UR measures the number of workers seeking employment relative to the total number of individuals who decide to participate in the labor market. Therefore, two forces interact to determine it. On the one hand, labor demand from firms and other employers determines the number of employed individuals, which is measured through the employment–to-population ratio (EPR). On the other hand, labor supply from workers is measured through the labor force participation rate (TGP in Spanish). These rates measure employment and participation in the labor market as a proportion of the working-age population.
(March 2021 to June 2025)
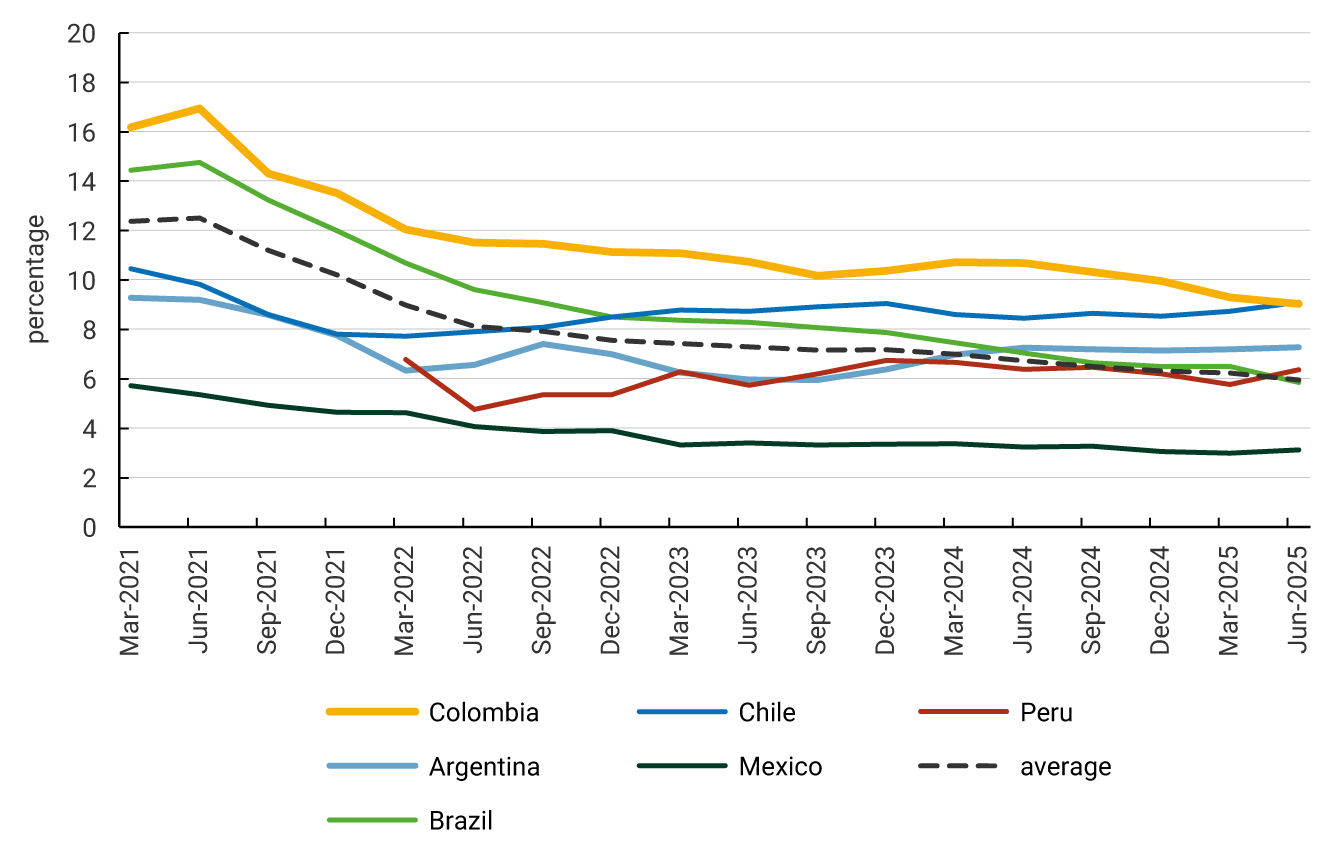
Source: National Administrative Department of Statistics (DANE in Spanish), Official Colombian Household Survey (GEIH in Spanish); National Institute of Statistics and Censuses of Argentina (INDEC in Spanish), Permanent Survey of Households (EPH in Spanish); Brazilian Institute of Geography and Statistics (IBGE in Portuguese), Continuous National Household Sample Survey (PNADC in Portuguese); National Institute of Statistics (INE in Spanish), National Employment Survey (ENE in Spanish); National Institute of Statistics and Geography (INEGI in Spanish), National Survey of Occupation and Employment (ENOE in Spanish); National Institute of Statistics and Informatics (INEI in Spanish), Permanent Survey of National Employment (EPEN in Spanish); author’s calculations.
When analyzing the differences in these variables between Colombia and other countries in the region, it is observed that Colombia’s employment-to-population ratio (EPR) has converged in recent years toward levels similar to the regional average, at around 60%. However, Colombia’s labor force participation rate (TGP) stands out in the region, standing at around 1.5 percentage points above the regional average, as shown in Table 1. Among the countries presented, only Peru exhibits a higher participation rate. That is, labor demand in Colombia is comparable to that of the region, but labor supply from workers is higher. The analysis shows, for example, that workers with college degrees and women have higher labor force participation rates than the average of their regional counterparts.
Table 1. Labor Force Participation Rate in Latin American Countries
(June 2025)
| Country | TGP (June 2025) |
|---|---|
| Average | 64.23 |
| Colombia | 65.70 |
| Argentina | 62.31 |
| Brazil | 65.02 |
| Chile | 62.75 |
| Mexico | 60.92 |
| Peru | 67.,93 |
Note: Quarterly and seasonally adjusted data.
Fuente: DANE, GEIH; INDEC, EPH; IBGE, PNADC; INE, ENE; INEGI, ENOE; INEI, EPEN; author’s calculations.
Graph 2 shows, year by year, the importance of each factor in explaining the difference between Colombia’s UR and the regional average. As can be seen, in 2021 and 2022, the difference in Colombia’s EPR relative to the region explained the bulk of this gap. However, since 2023 the gap has been explained mainly by the difference between Colombia’s TGP and that of the region. That is, the difference between Colombia’s UR and that of other countries is mainly due to Colombia's higher labor force participation. The authors estimate that if Colombia had the same TGP as the regional average, its UR would be close to 7.0%, that is, about 2.5 percentage points below the level observed in the first half of 2025 and closer to the regional average.
(March 2021 to June 2025)
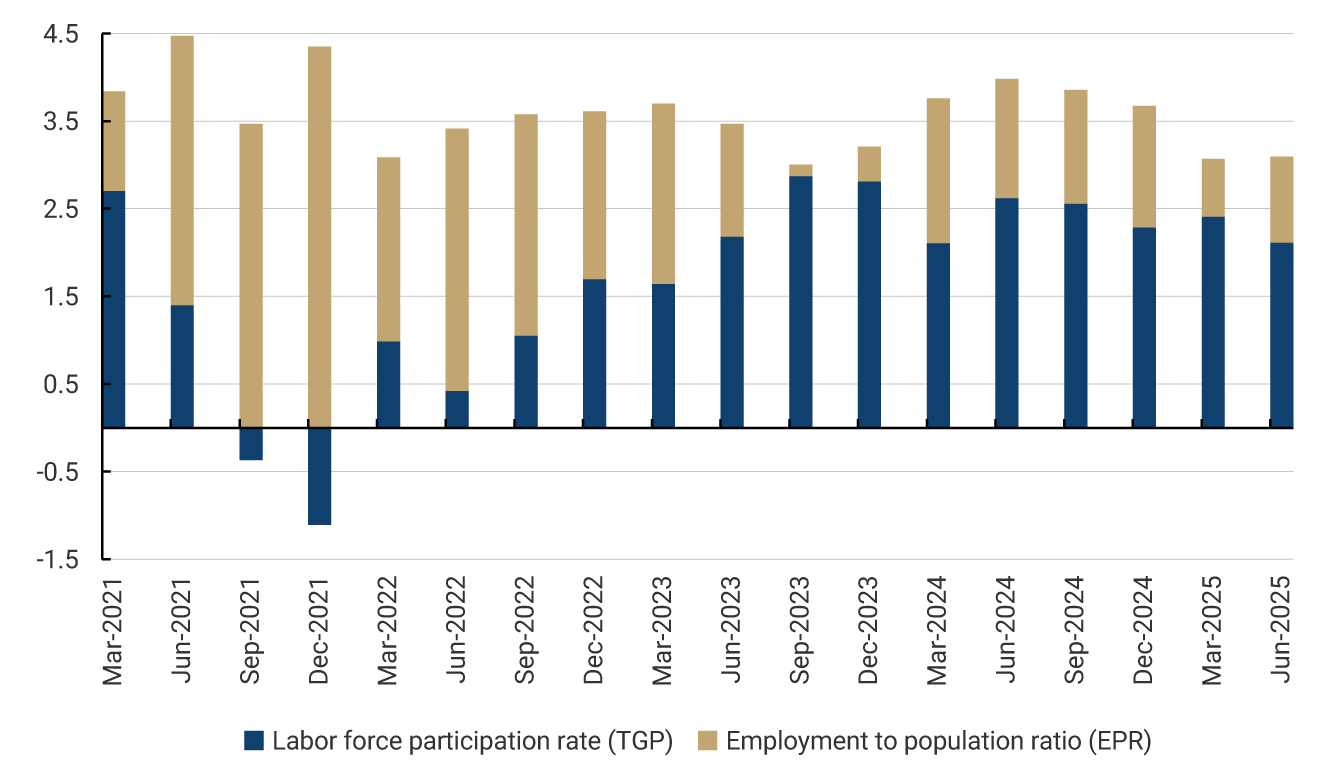
Source: Author’s calculations.
In conclusion, the Colombian labor market differs from that of other countries in the region by exhibiting a structurally higher pressure from labor supply, particularly among groups such as women, whose participation is significantly higher than in other countries. This explains why, even with employment-to-population rates close to the regional average, Colombia keeps showing higher unemployment rates. For economic policy, these results pose the challenge of facilitating the creation of more jobs and making better use of a larger labor supply.