The Colombian economy has been increasing its growth pace over the past quarters in response to the strengthening of domestic demand, which expanded by 4.3% annually in the first half of 2025, more than double its growth in 2024 (2.0%). The rise in domestic demand has been driven by the notable recovery of household consumption, which grew at a 4.0% annual rate during the first half of the year, significantly above the 1.6% growth recorded in 2024.
Box 1 of the July 2025 Report to Congress, of the Board of Directors of Banco de la República (the Central Bank of Colombia) analyzes the factors that have contributed to household consumption growing at rates higher than those of Gross Domestic Product (GDP), currently reaching levels significantly above those that would have been observed had the pre-pandemic trend (2015-2019) continued. The factors identified are classified into two main groups: (i) those influencing the households’ greater willingness to consume, and (ii) those that have contributed to increasing households’ disposable income, and consequently, to their purchasing power.
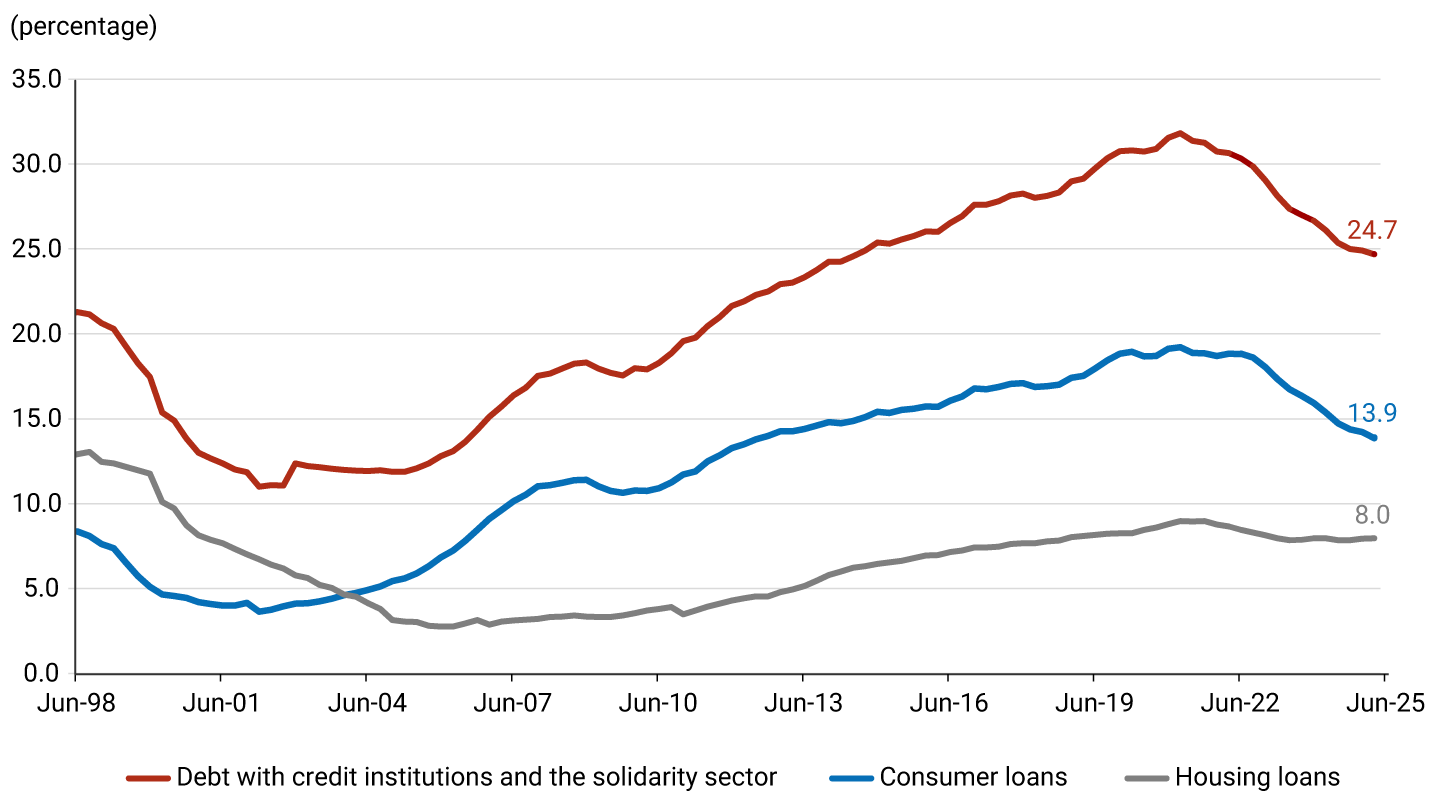
Regarding the factors that increase households’ willingness to consume, there is no doubt that the gradual decline in inflation plays a key role by improving consumers’ real income. Additionally, the reduction in the policy interest rate implemented since December 2023 has been reflected in lower interest rates on household loans, which has supported consumption growth (Graph 1, Panel A). Similarly, the decline in households’ debt-to-disposable-income ratio contributes to increase the banks’ willingness to grant loans to families and households’ incentives to seek credit to finance their consumption (Graph 1, Panel B).
Graph 1. Household Financial Conditions
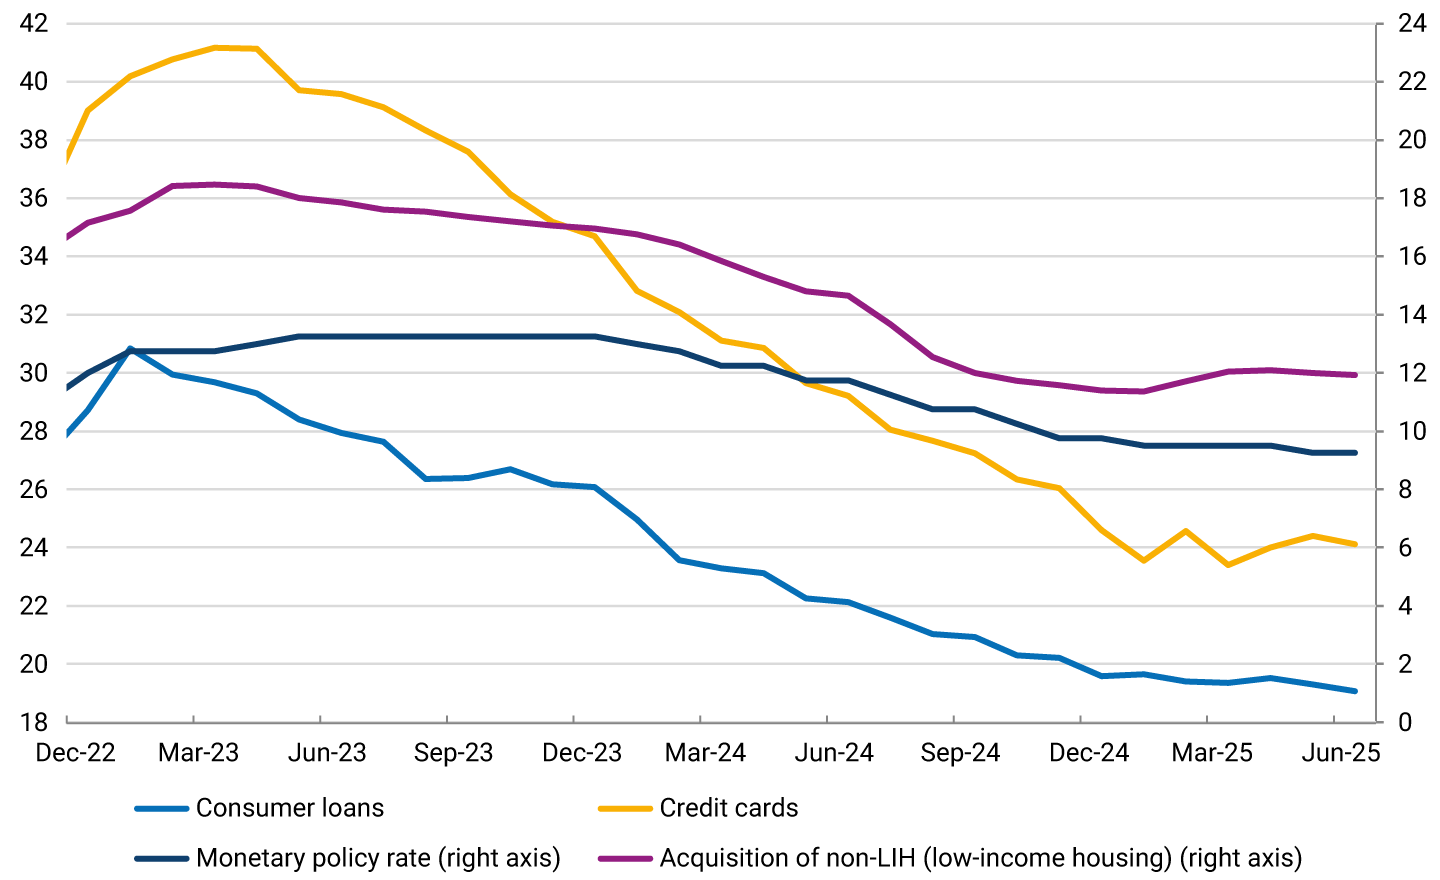
This has been reflected in a greater dynamism in consumer loan disbursements, which showed a significant recovery, reaching real annual growth rates close to 30% by the end of the first half of 2025. Some analyses by Banco de la República’s technical staff suggest that these disbursements exhibit a positive and significant correlation with private consumption, particularly in durable and semi-durable goods. In the case of durable goods, consumption has also been driven by the revaluation of the exchange rate, which lowers the cost of imports.
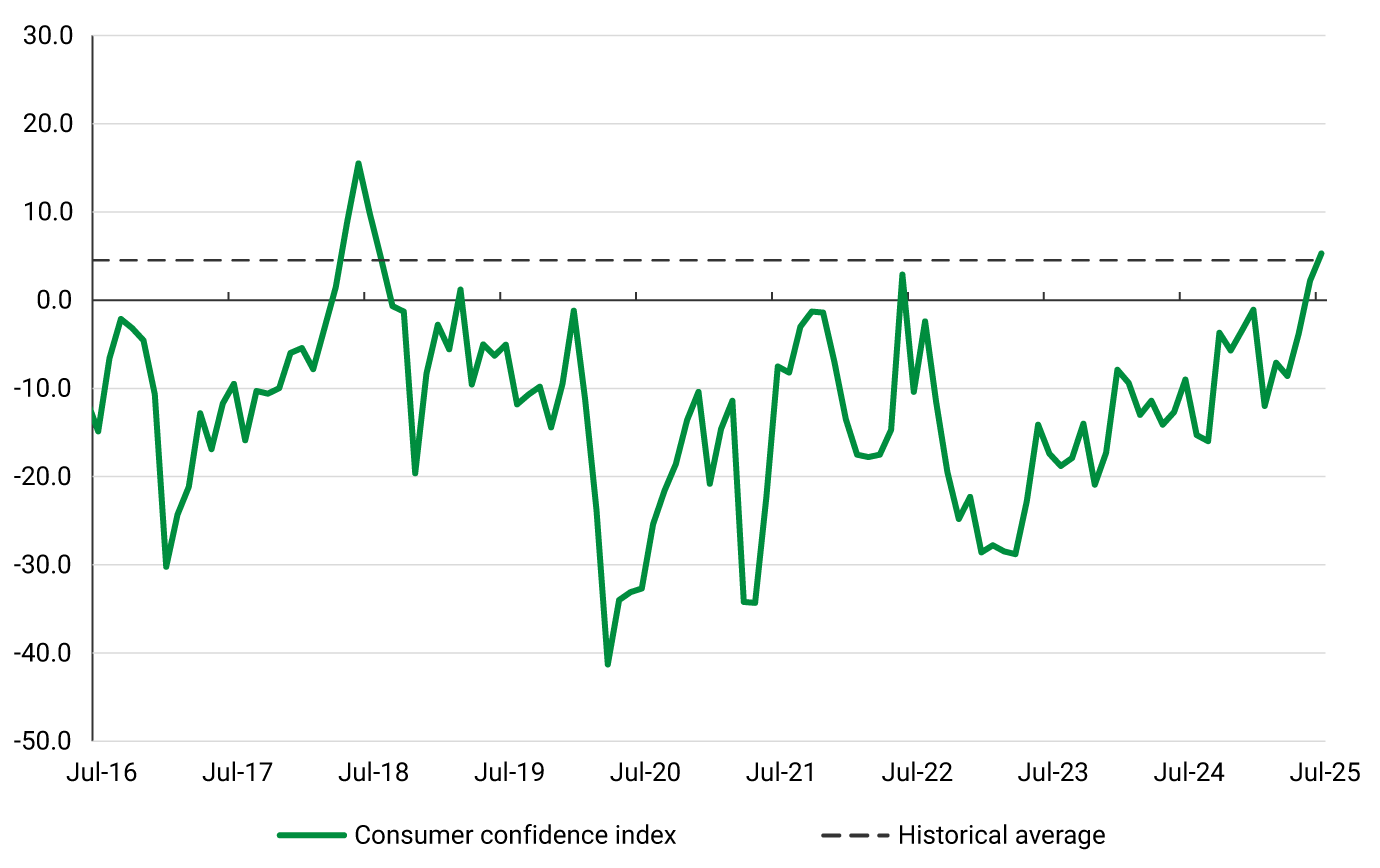
Another factor that has contributed to increasing households' willingness to consume is the gradual improvement in the consumer confidence index, whose positive trend intensified in the first half of 2025, reaching its historical average. This was primarily driven by the recovery of the component reflecting households’ perception of economic conditions (Graph 2).
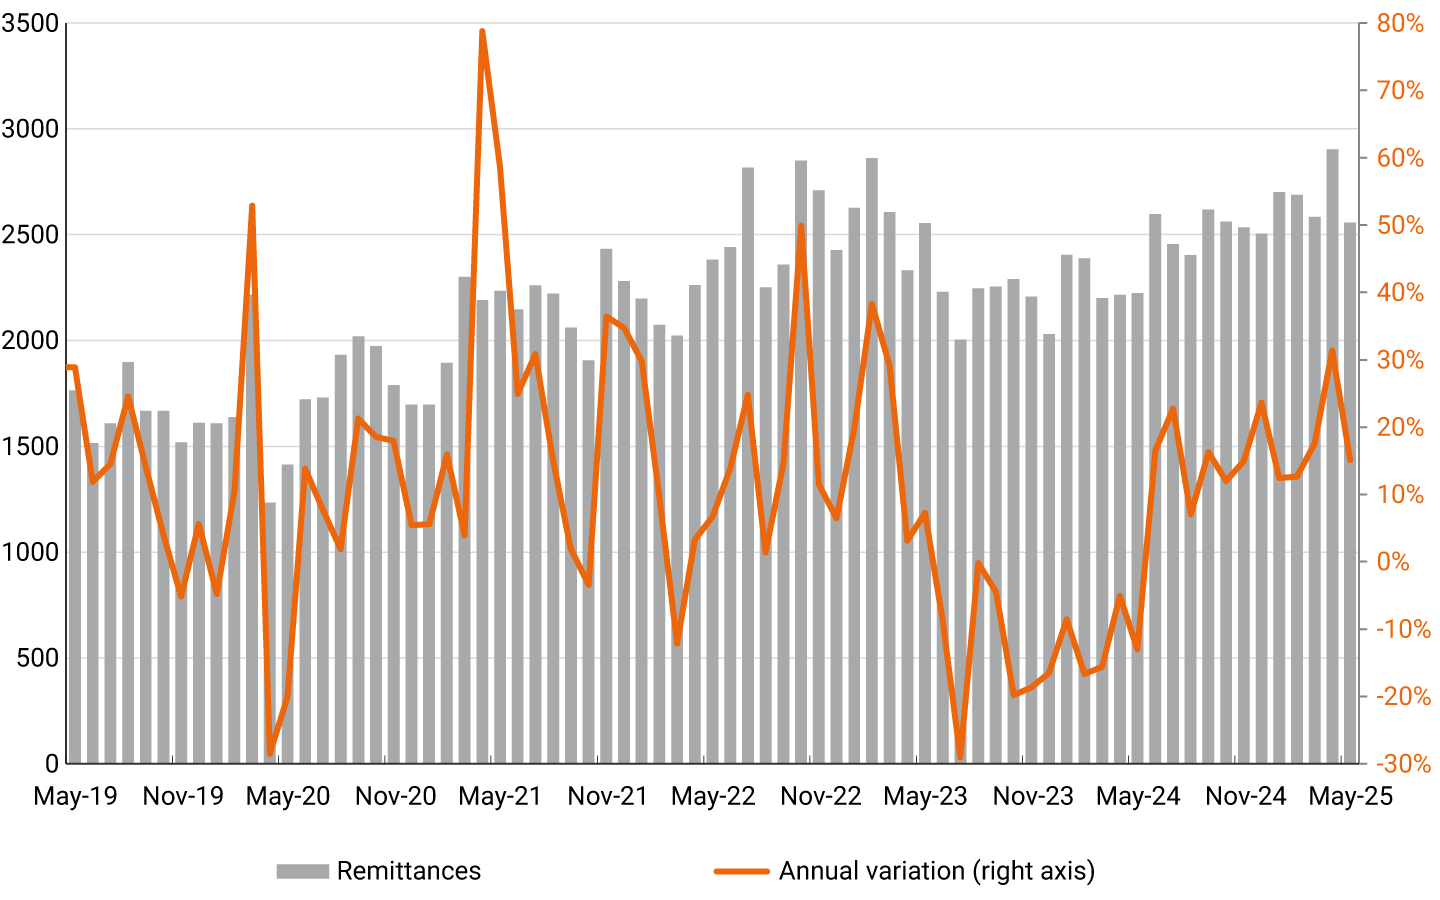
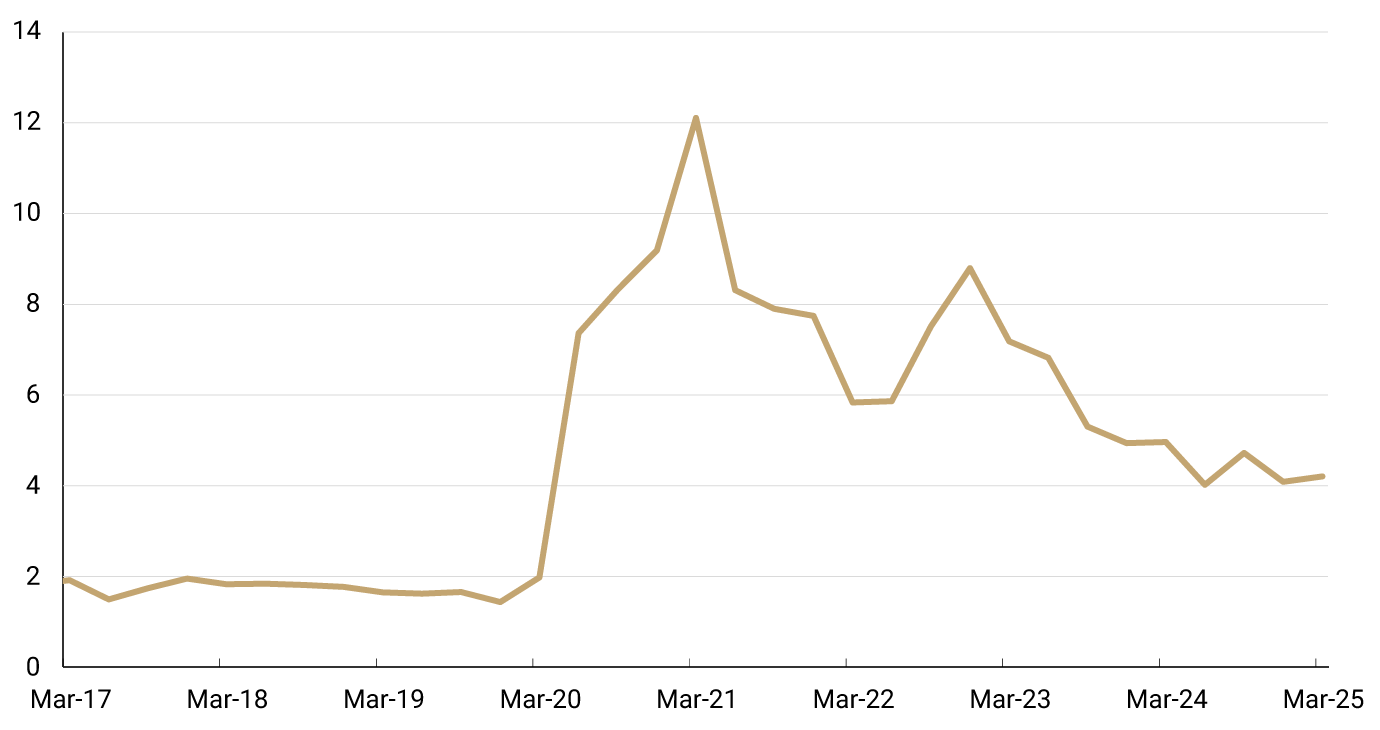
As for the factors that have contributed to increase households’ disposable income, the report highlights workers' remittance inflows, which reached historical levels in April-May, growing at a real annual rate above 20% after expanding by 16.6% in 2024 (Graph 3, Panel A). In addition, money transfers from the Central National Government (CNG) to households, which, albeit decreasing in 2023 and 2024 with the end of the most critical period of the pandemic and the subsequent consolidation of various government programs into the Renta Solidaria (Solidarity Income) program, currently account for around 0.5% of households' disposable income, a figure still considerably higher than pre-pandemic levels (Graph 3, Panel B). Regarding this last point, it should be noted that fiscal stimulus on economic activity (reflected, for example, in the widening of the Central National Government’s deficit in 2025) constitutes a short-term boost to disposable income and aggregate demand, although its persistence over time will depend on the sustainability of public debt levels.
Graph 3. Transfers to Households
(billions of real pesos*, seasonally adjusted and corrected for calendar effects [DAEC in Spanish], and annual change)
(trillions of 2015 pesos*, four-quarter cumulative)
Another factor that has increased households’ disposable income is the rise in the income of coffee-growing families, which, according to the National Federation of Coffee Growers, number around 557,000. The same source reports coffee production and the domestic reference price, which are used to estimate the income generated by this activity. Some estimates suggest that this income represented 1.0% of households’ disposable income in 2024. In February 2025, coffee income reached a historical high of COP 1.1 trillion, and although it has since moderated, its annual growth in June remained significant (14.8%).
Another important factor that has improved households’ disposable income is the increase in the employed population, which grew by 3.6% annually by the end of June at the national aggregate, in a context of improving real wages for salaried workers, driven by the gradual decline in inflation and increases in the minimum wage.
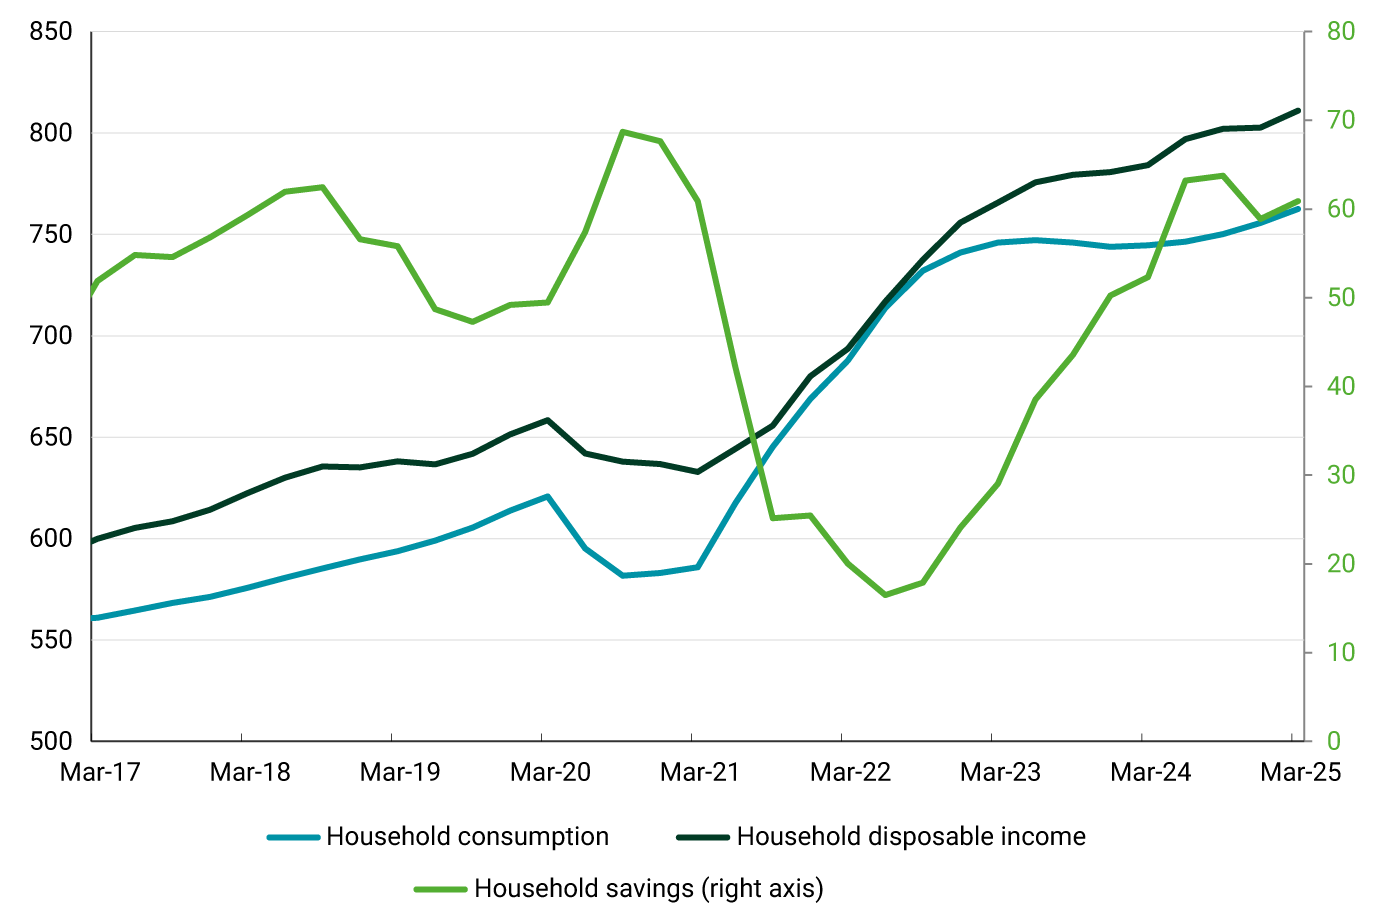
All of the above is summarized in Graph 4, which shows the evolution of households’ disposable income, consumption, and savings. In real terms, using the private consumption deflator, disposable income grew by 2.8% in 2024 and by 4.4% annually in the first quarter of 2025. Based on four-quarter cumulative figures, the growth of disposable income during 2023 and 2024 exceeded that of private consumption. This resulted in increases in household savings in both years, a trend that continued into the first quarter. This suggests the availability of resources that could support private consumption for the remainder of the year and possibly into part of 2026.
(trillions of 2015 pesos*, four-quarter cumulative)