A recent paper from the journal Essays on Economic Policy (ESPE in Spanish) by Banco de la República (the Central Bank of Colombia) deals with the financial and fiscal aspects of the Colombian health care system and includes a chapter focusing on the macroeconomic risks it faces. This chapter, prepared by economists from the Bank together with external researchers, analyzes the dynamics of the markets on which the system relies and the effects that the system’s forms of financing have on its operation and that of the economy. The study is based on a general equilibrium model of the entire economy and explicitly considers the impact of the evolution of the population, access to new procedures and medication, and the efficient use of the resources that society allocates to the system.
The study calculates the combined effect between 2023 and 2030 of the aging in the population, the increase in the demand for services, the political intent to equalize benefits between the contributory and subsidized plans, and the improvement in access to marginalized population groups within the system. It is estimated that these expected shocks will generate the need for resources equivalent to 6.8% of GDP to meet health care needs in 2030, even without considering investment expenses in infrastructure or public health and prevention.
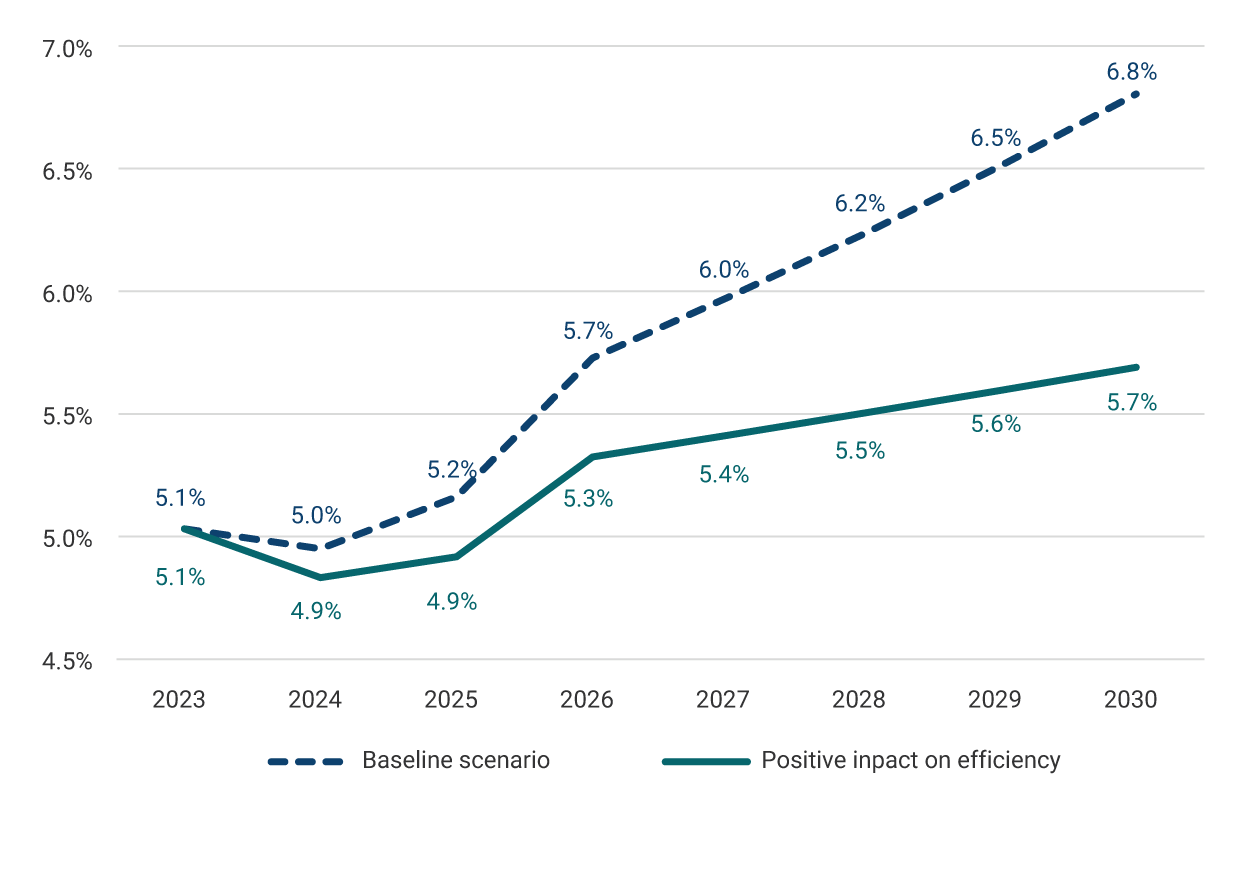
Graph 1 presents the health expenditure between 2023 and 2030 in a reference scenario that incorporates the expected shocks and compares it with an inertial baseline scenario, without equalization of benefits or improvement in access. As can be seen, in the reference scenario, the need for resources increases substantially more than in the inertial scenario, which implies a public policy challenge to guarantee the sustainability of the system, which is an essential characteristic of a health insurance system.
The study analyzes the impact on health expenditure of measures that improve the efficiency of the system or strengthen the operation of the economy and the labor market. First, an improvement in the average efficiency of Healthcare Service Providers (IPS in Spanish) is considered through efficient contracting mechanisms and structured incentives that encourage an orientation towards health outcomes rather than the proliferation of health care events. The results of this estimation are presented in Panel A of Graph 2. As can be seen, the efficiency improvements considered would reduce resource needs by somewhat over 1.0% of GDP in 2030, thus relieving pressures on the National Government’s budget.
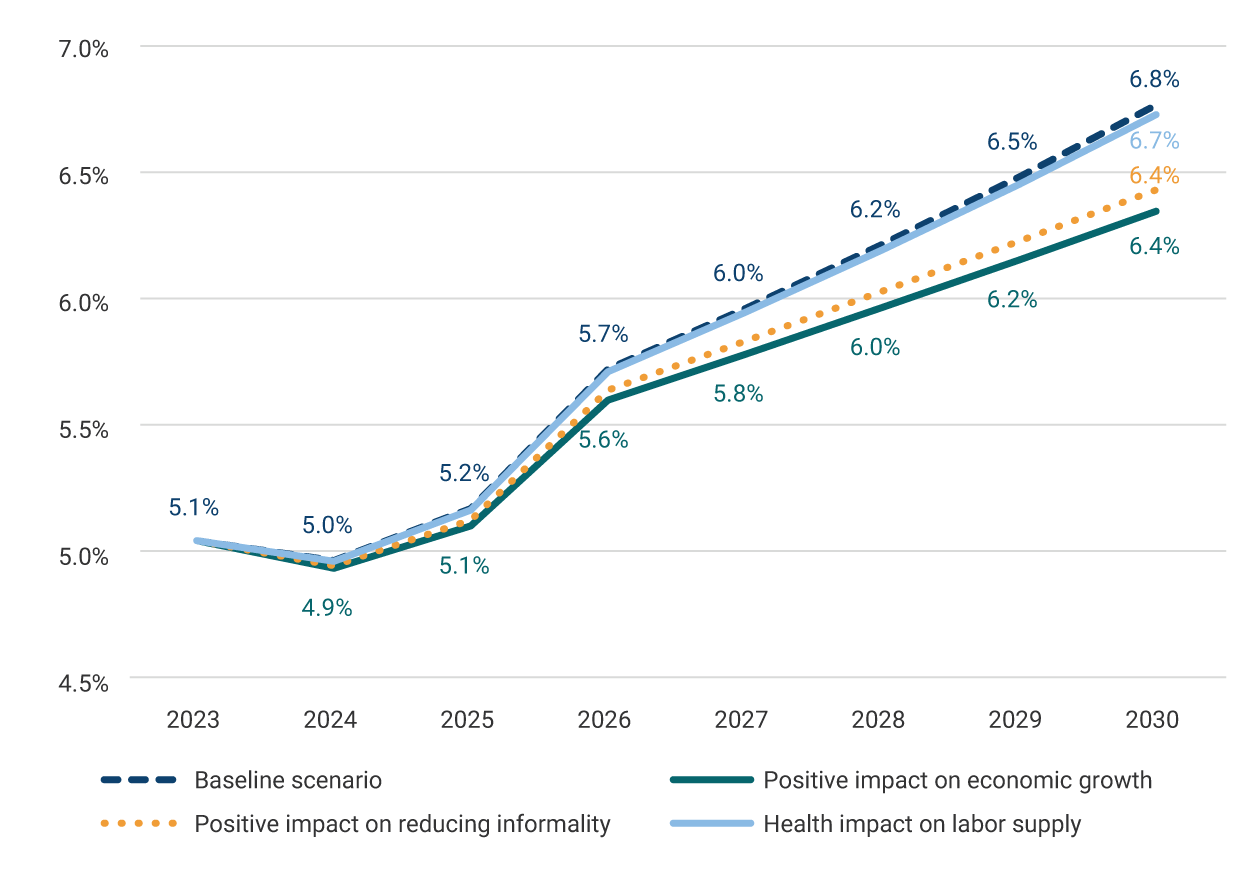
The study also estimates the impact of a set of measures to strengthen economic growth and labor formalization through improvements in total factor productivity and the positive effects of health on economic performance. The results of this exercise are presented in panel B of Graph 2, which again shows the resource requirements of the system and the contribution of the proposed measures. As can be seen, the sum of the savings generated by the three components in the alternative scenarios is equivalent to a reduction in resource needs of 0.9% of GDP in 2030.
In sum, the study shows the magnitude of the pressures that the system will face in the coming years. In addition, the study demonstrates that improvements in risk management and incentive-driven hiring schemes, the impulse of labor formalization, and vigorous economic growth would contribute significantly to the sustainability of the system. These measures have the potential to significantly reduce fiscal efforts while improving access and strengthening health outcomes for the population.