Since 2009, the Financial Stability Department of Banco de la República (the Central Bank of Colombia) has been conducting the quarterly survey on the credit situation in Colombia. This survey is addressed to financial market intermediaries that carry out credit transactions (banks, commercial finance companies, and financial cooperatives). It aims to analyze the institutions' perceptions on supply, demand, and access to credit, short-term changes in allocation policies, and financial intermediaries' expectations for the following quarter. Next is a summary of the latest survey results, details of which are presented in the Credit Situation Report for the Second Quarter of 2021 (only in Spanish).
As the first survey result, Graph 1 exhibits the change indicators in the requirements for granting new loans (supply indicator) and the intermediaries' perception of the demand for credit (demand indicator). For both indicators, a positive record suggests that a majority of institutions perceive that credit supply or demand, as the case may be, is increasing. The first one measures the difference (as a percentage of the total number of institutions) between the number of institutions considered less restrictive when granting loans in the last quarter and the number of those considered more restrictive. The second one corresponds to the difference (again, as a percentage) between the number of institutions that perceived higher demand for credit in the last quarter and those that perceived lower demand. Naturally, the farther the indicators are from zero, the more agreement there is among institutions on the direction in which credit supply and demand are moving, so the interpretation of the indicators must consider not only their sign but also their magnitude.
Due to the contraction in economic activity caused by the health emergency, supply and demand indicators fell sharply, reaching minimum levels during the third and fourth quarters of 2020. The indicators also suggest that supply declined before demand, although the decline in demand was much larger. Since the beginning of 2021, both the perception of credit demand and supply have recovered and were in positive territory as of June.
Graph 1. Credit Supply and Demand Perception Indicators
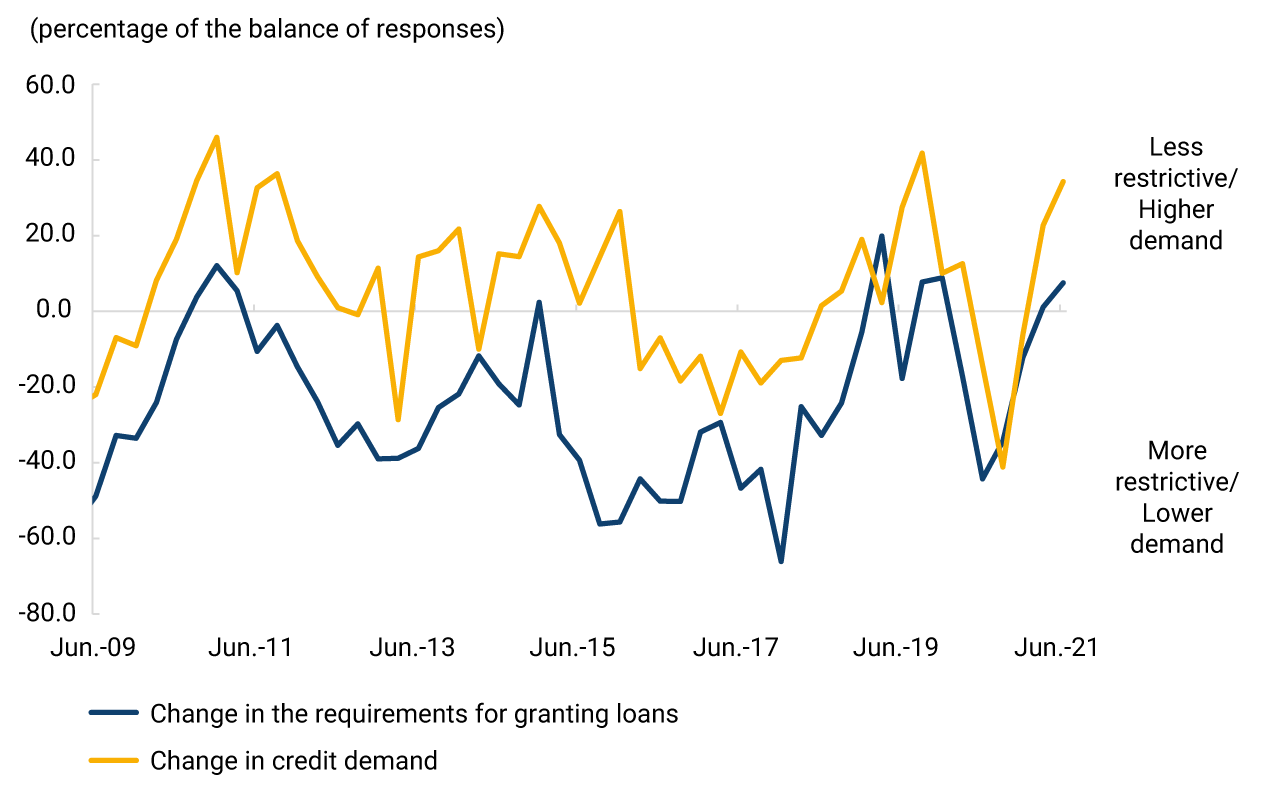
Source: Banco de la República; Survey on the Credit Situation in Colombia.
These indicators are also prepared by type of loan to analyze the dynamics of household (consumer and housing) and corporate (commercial and microcredit) portfolios.
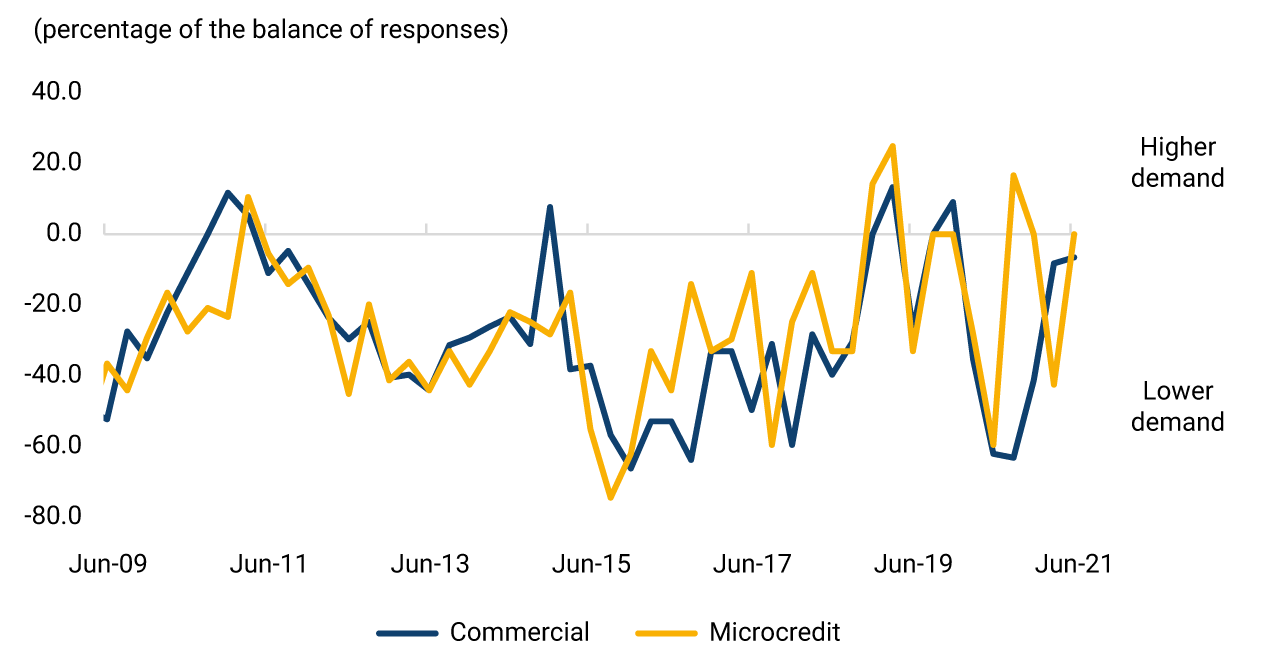
In line with the performance of the total portfolio, demand indicators for each type of loan fell sharply until the third quarter of 2020 and, thereafter, began to recover (Graph 2). For the second quarter of 2021, the indicators for the commercial and housing portfolios continued to recover and reached pre-pandemic levels. In contrast, consumer and microcredit portfolios experienced a decline, although they remained positive.
Graph 2. Change in the Perception of Demand for New Loans
Panel A. Household portfolio
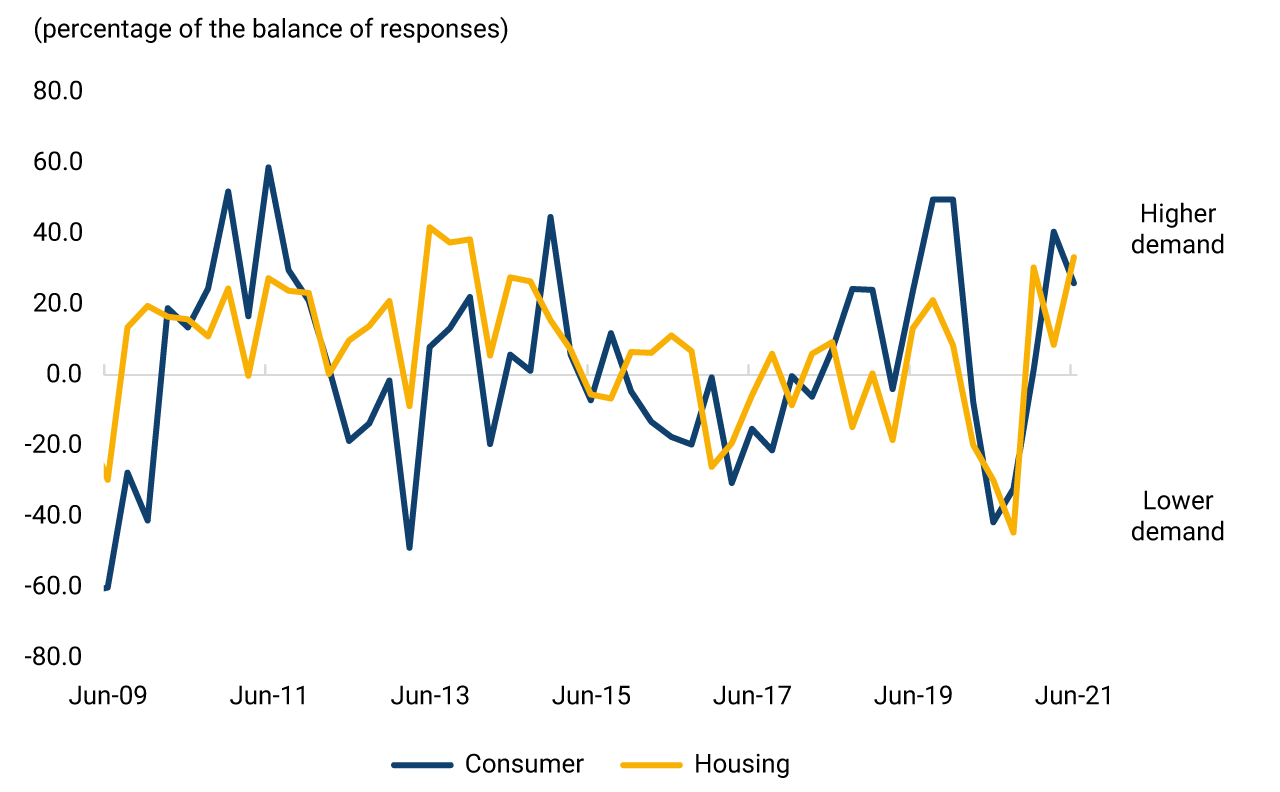
Panel B. Portfolio of firms
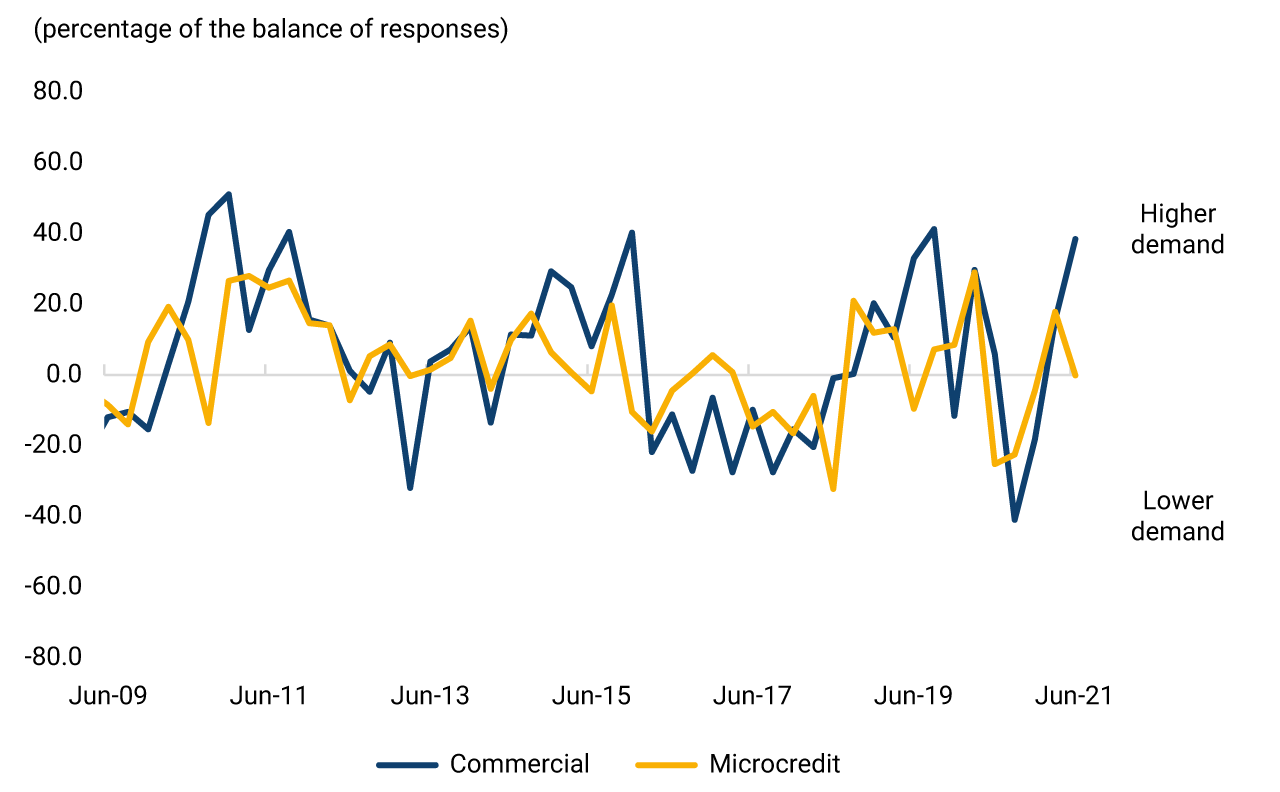
Source: Banco de la República; Survey on the Credit Situation in Colombia.
The supply indicators for the household portfolio as of June 2021 show a recovery similar to that observed for the entire portfolio. However, the performance differs between the consumer and housing portfolios. While the supply indicator for the consumer portfolio fell into negative territory throughout 2020, the housing portfolio remained consistently positive (Graph 3, panel A). Meanwhile, the supply indicators for corporate loans have recovered less strongly, although they reflect the general recovery trend (Graph 3, Panel B).
Graph 3. Change Indicator in the Requirements for Granting New Loans by Type of Portfolio
Panel A. Household portfolio
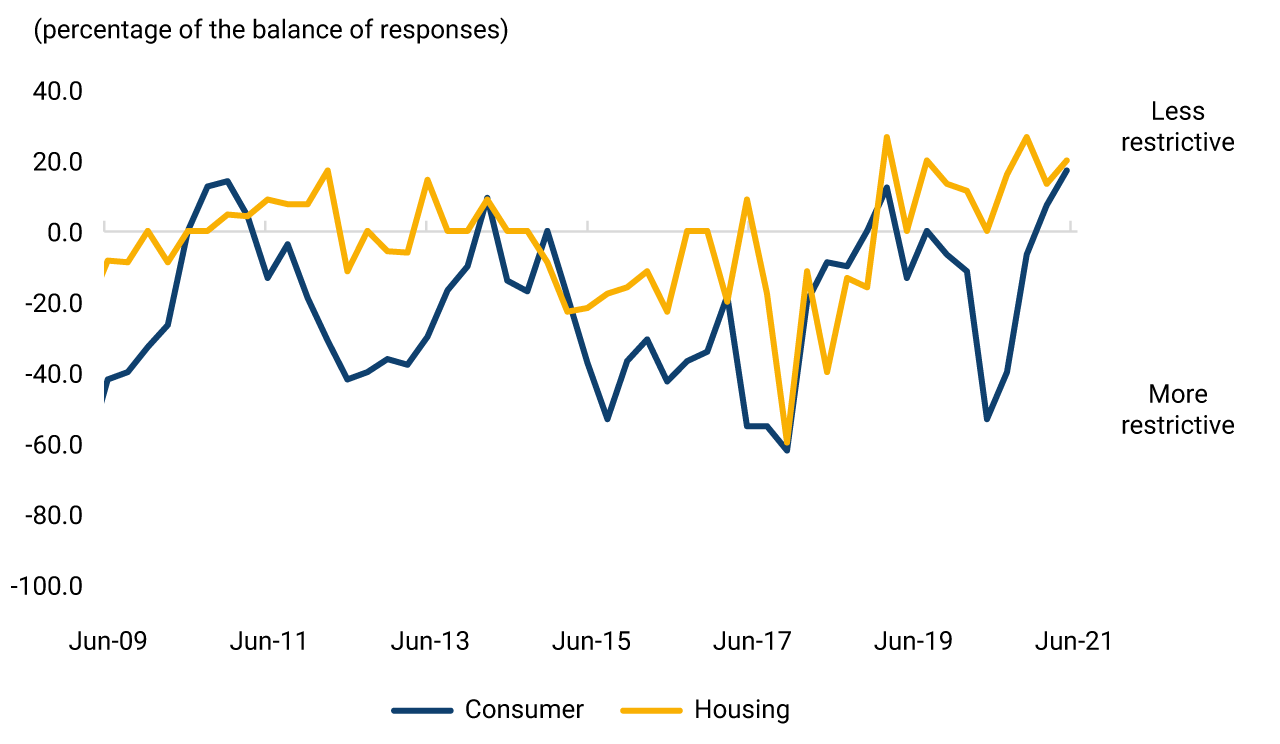
Panel B. Portfolio of firms
Source: Banco de la República; Survey on the Credit Situation in Colombia.