Labor Market Reports - Stronger Employment Dynamics driven by Rural Areas and the Effects of reducing Non-Wage Labor Costs
The Labor Market Report (RML in Spanish) series is a quarterly publication by the Labor Market Analysis Group (GAMLA, in Spanish) of Banco de la República (the Central Bank of Colombia), a group created in 2017. Opinions and possible errors are the author’s sole responsibility, and its contents do not compromise Banco de la República nor its Board of Directors.
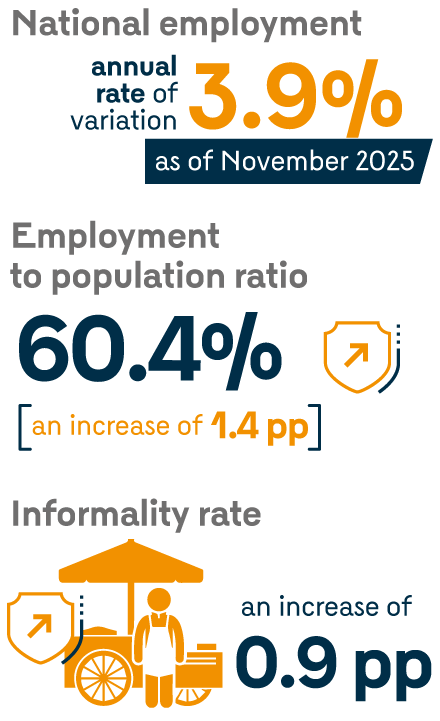
According to the Colombian Household Survey (GEIH, by its acronym in Spanish), as of November 2025, national employment continued to increase at an annual rate of 3.9%, mainly explained by the strong performance in rural areas (with a percentage increase of 4.2%). By economic sectors, those that contributed the most to employment growth were agriculture, commerce, and accommodation, as well as transportation and communications. This contrasts with the negative contribution of professional activities and other sectors (such as mining and electricity, gas, and water).
According to the Colombian Household Survey (GEIH), as of November 20251 national employment continued to increase at an annual rate of 3.9%.
- This was mainly explained by the strong performance in rural areas2 (with a percentage increase of 4.2%).
- This led to a rise in the national employment-to-population ratio (EPR) of 1.4 percentage points (pp), placing it at 60.4%.
- By employment status, in line with the dynamism in rural areas, a higher increase was observed in non-salaried employment, with an annual variation of 4.3%, compared with 3.4% in the salaried segment.
- This resulted in a 0.9 pp increment in the national informality rate (IR) compared to the level observed in September.
By economic sectors, those that contribute the most to employment growth were agriculture, commerce, and accommodation, as well as transportation and communications.
- This contrasts with the negative contribution of professional activities and other sectors (such as mining and electricity, gas, and water).
- Other sources of labor demand, such as vacancy indexes from help-wanted ads and the Public Employment Service (SPE in Spanish), remained stable as of October.
- However, the most recent data from Banco de la República’s Quarterly Survey of Economic Expectations (ETE in Spanish) show that, in both the short and medium term, the balance of hiring expectations is negative.

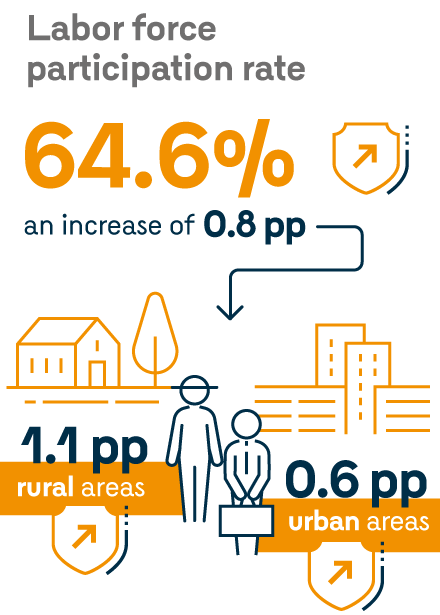
On the labor supply side, as of November, a reduction was observed in the population out of the labor force, which led to an increase in the national labor force participation rate (TGP in Spanish) of 0.8 pp, placing it at 64.6%.
- This increase in the TGP occurred mainly in rural areas, with an increment of 1.1 pp, compared to 0.6 pp observed in urban areas.
- This higher labor force participation was more than offset by employment growth, which allowed for a moderate decrease in the unemployment rate (UR) across all geographic domains.
Finally, the combination of vacancy indexes and the UR, also known as the Beveridge curve (BC), shows a still tight labor market.
- The urban UR has been low by historical standards in recent months, which is consistent with the observed increases in real labor income. As of October, such income continued to rise significantly.
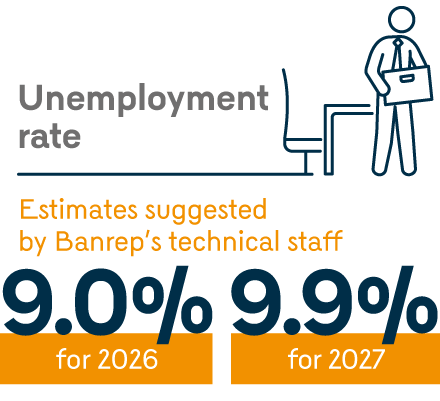
- Based on this, the UR estimates suggested by Banco de la República’s technical staff, whose risk scenarios are explained in the latest Monetary Policy Report (MPR, January 2026), suggest that the average urban UR is likely to be 9.0% for 2026 and 9.9% for 2027.
As usual, this report is divided into two sections. The first provides a detailed analysis of the current labor market situation, and the second examines the effects of a policy aimed at reducing non-wage labor costs, such as the tax reform approved in 2012, using a tool developed by the Central Bank’s technical staff, consisting of a dynamic general equilibrium model with an economy-wide structure and a detailed characterization of the labor market in a country such as Colombia.
1 ↑ In this report, data are presented in rolling quarters and seasonally adjusted.
2 ↑ The rural area comprises the aggregate of other municipalities and rural areas.