The Balance of payments of Colombia for 2024 and 2025 shows that between these two years, the current account deficit as a share of GDP (Gross Domestic Product) rose from 1.7% to 2.4%, equivalent to an increase of USD 3,871 million (m) in absolute terms. The main factor behind this result was the widening of the trade deficit of the balance of goods, which was partially offset by the surplus in current transfers, reflecting the strong growth in workers’ remittances, whose underlying drivers were discussed in an earlier blog post. The second most important factor offsetting this imbalance was a reduction of USD 488 m of the deficit of the balance of services. This improvement in the balance of services was largely driven by a nearly 9.0% growth in service exports in 2025.
A recent study on Colombia’s foreign trade of services, prepared by Enrique Montes, Sandra Salamanca, and Juan Sebastián Silva Rodríguez, researchers from Banco de la República (the Central Bank of Colombia), includes various metrics that highlight the growing importance of service exports in the country throughout the twenty-first century (Table 1).
Table 1. Relative Importance of Service Exports
in Colombia’s Economic Accounts
Service exports (percentage) | ||||
|---|---|---|---|---|
| Economic account | 2000 | 2014 | 2019 | 2025 |
| GDP | 2% | 2% | 3% | 4% |
| Services GDP | 9% | 8% | 11% | 14% |
| Current income | 11% | 11% | 16% | 20% |
| Goods exports | 15% | 15% | 26% | 38% |
Between 2000 and 2025, service exports doubled their share of GDP, while their relative size compared with goods exports increased from 15% to 38%1. Likewise, external sales of services have gained importance as a source of the country’s current external income and have increased their share in the services sector of GDP2. The expansion of service exports has occurred in the context of rising global demand, which has facilitated their integration into global value chains. The study shows that the increasing use of information and communications technologies (ICT) has made it possible to expand the range of services that can be traded electronically.
Given the advances in ICT and the Internet and their facilitating effects on the commercialization of services, these are classified into two categories: traditional and modern services. Traditional services are those that require the physical presence of both the provider and the consumer in order to be traded, such as transportation and travel services, government services, maintenance and repair services, and personal, cultural, and recreational services, among others. Modern services are those whose provision does not require person-to-person interaction. These include telecommunications, computer and information services, financial services, insurance services, charges for the use of intellectual property, call centers, and other business services.
Based on this classification, it can be noted that the composition of world trade in services has gradually shifted toward modern services, which have accounted for more than half of this trade in recent years (Graph 1). This is explained by the stronger growth of business services and ICT-intensive services, as well as by the impact of the pandemic, which mainly affected services requiring face-to-face interaction between providers and consumers and encouraged the use of virtual interactions.
(Exports and Imports)
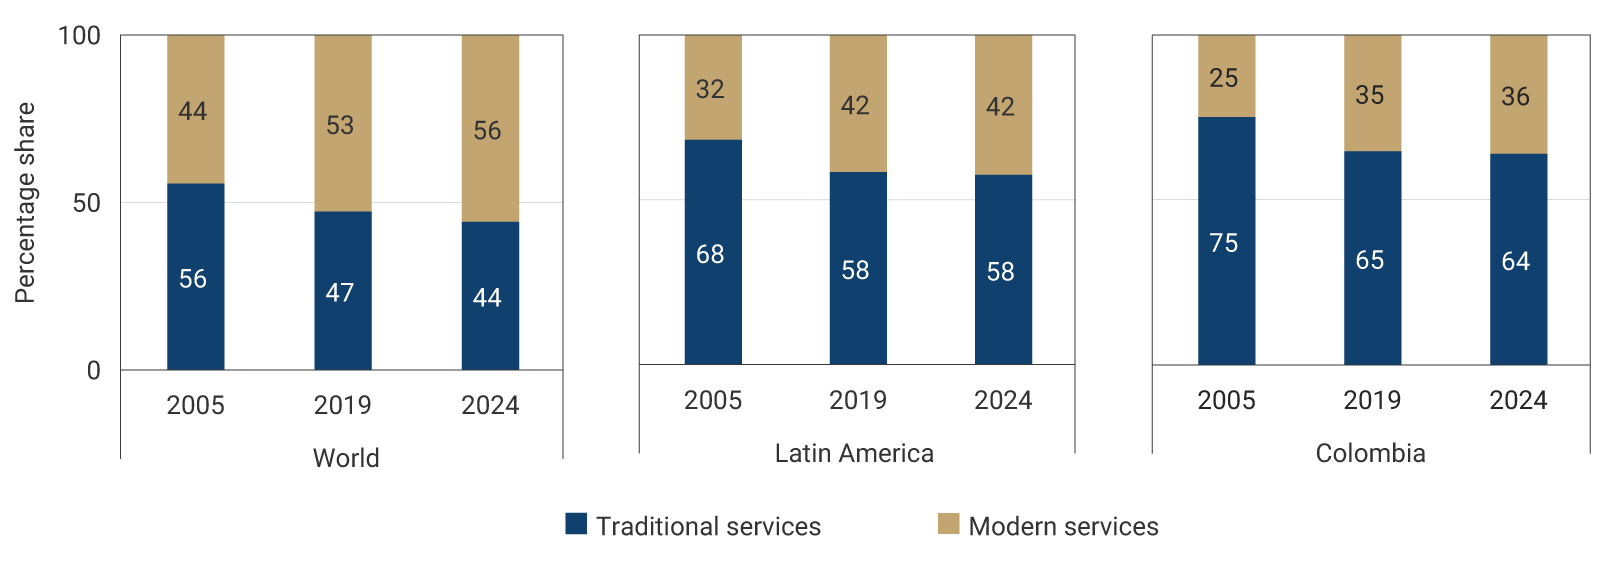
Regarding Latin America and Colombia, the share of traditional services still accounts for more than half of the total value of services trade. However, a gradual increase in the importance of modern services is also observed.
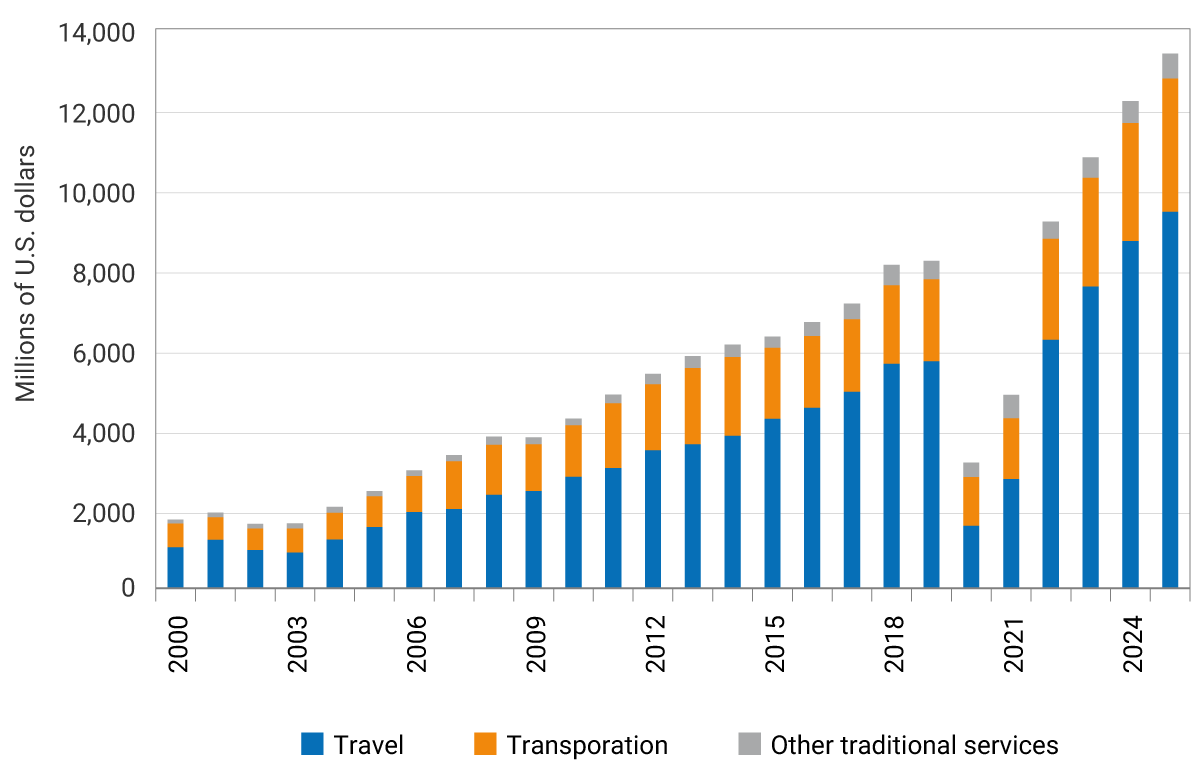
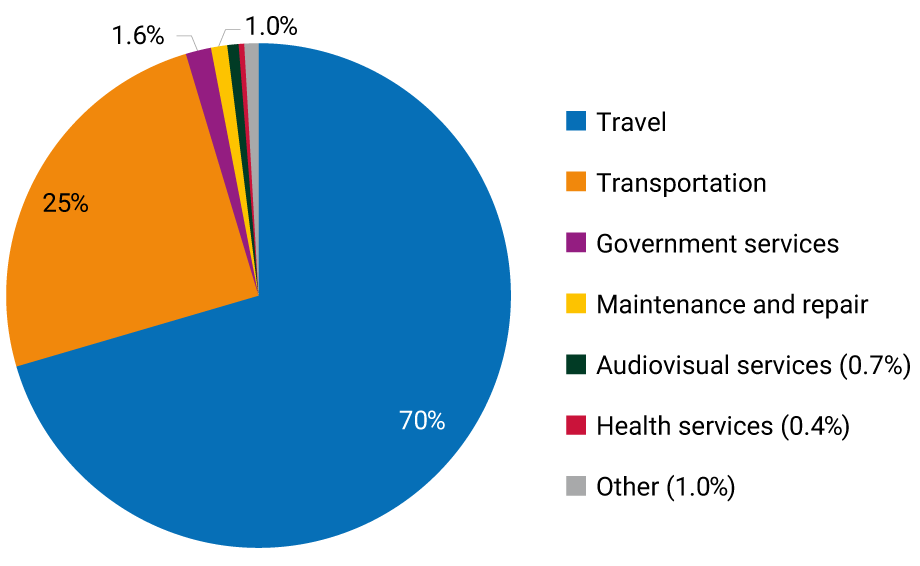
In Colombia, the growth of traditional service exports has been driven by the performance of the travel category (Graph 2A). This result is mainly associated with the increase in foreign visitors, the rising number of Colombians living abroad, and the expansion of the country’s tourism infrastructure. Transportation services follow in importance, particularly air passenger transport. Among the other traditional services with smaller shares are government services, maintenance and repair services, audiovisual services, and health services (Graph 2B).
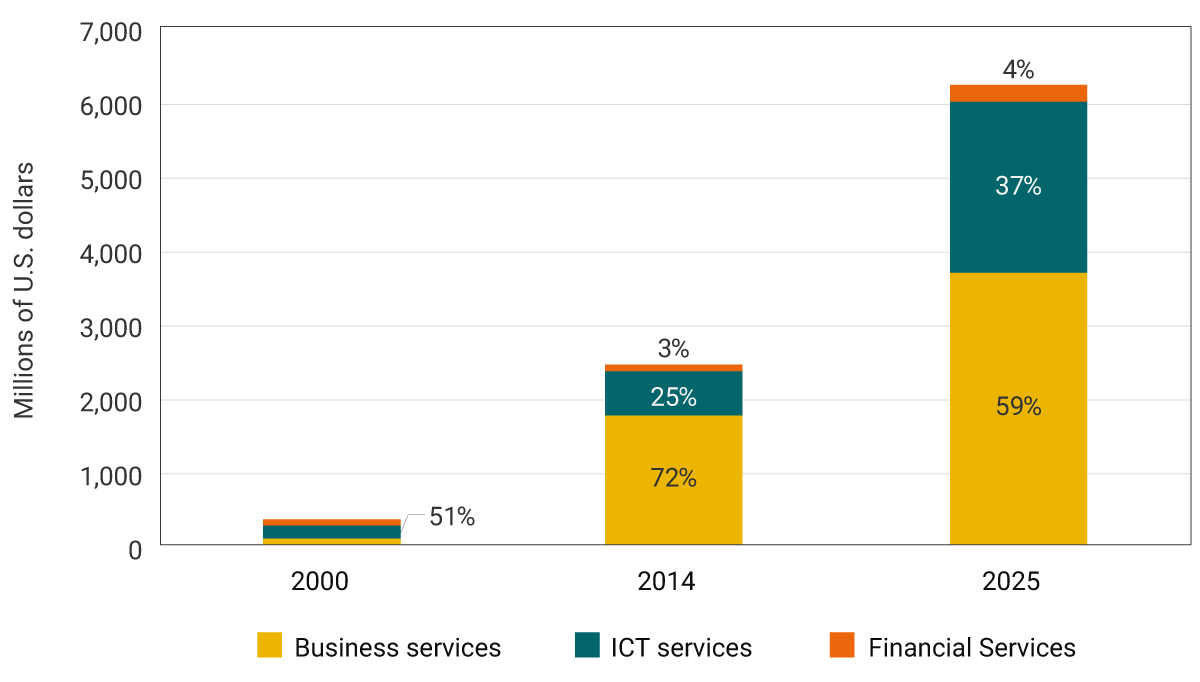
The group of modern service exports includes ICT services, comprising telecommunications, computer services, and information services. In 2025, these accounted for 37% of modern services exports (Graph 3), with software development and application services standing out within this category. In addition, business services include charges for the use of intellectual property and other business services, which grew steadily from 2005, reaching 59% of these exports in 2025. Within this group, contact center services and management consulting services stand out. Insurance and financial services have accounted for approximately 4.0% of the value of modern service exports in recent years.
In summary, beyond tourism, which is a key source of foreign exchange and continues to lead traditional service exports, the development of modern services constitutes an opportunity for Colombia, as it involves innovation and development processes, employs more highly skilled human capital, and is more deeply integrated into global value chains, thereby offering broad potential to generate high-quality formal employment and diversify the country’s export base.
1 ↑ It is worth noticing that measuring foreign trade in services poses challenges to identifythe total number of transactions carried out, as well as the value of services embedded in traded goods that are not recorded separately.
2 ↑ Including air transport; warehousing and transport support activities; postal and courier activities; accommodation and food services; information and communications; professional, scientific and technical activities; administrative and support service activities; insurance and financial activities; education; human health and social work activities; arts, entertainment and recreation activities; and other service activities. Source: National Accounts, National Administrative Department of Statistics (DANE in Spanish), Balance of Payments, Banco de la República. Authors' calculations.