Traditional indicators related to the financial situation of firms such as insolvency, delinquency, and asset impairment, are usually used to assess the fragility of the business sector.. However, there are other alternative indicators to study sectoral productive activity that are not usually considered. This article analyzes firm creation and destruction in Colombia, which is part of Box 2 of the Financial Stability Report for the first half of 2021 (only in Spanish).
Using information from the Ministry of Health and Social Protection's Planilla Integrada de Liquidación de Aportes - PILA (an integrated record of contributions to social security), the rates of creation and destruction of firms were calculated for each period and economic sector based on the dates on which a company begins and ends making social security contributions for its employees. In addition, having the records of the number of employees for each firm, these same rates were computed by firm size and the proportion of employment that is destroyed.
Results at the aggregate level show that the highest creation rate was recorded in January 2010 (21.5%), when 61,895 companies were created in the last twelve months, and the lowest rate was observed in June 2020 (13.1%; 50,662 companies). Meanwhile, the 2011-2019 period showed an average creation rate of 17.5%. As for destruction, since April 2017, observed growth has led this rate to exceed the creation rate. During the first half of 2020, this trend was accentuated, and in June 2020, 148,157 companies disappeared, representing an increase of 47.7% compared to June 2019 (Graph 1).
Graph 1. Aggregate creation, destruction, and non-payment rates
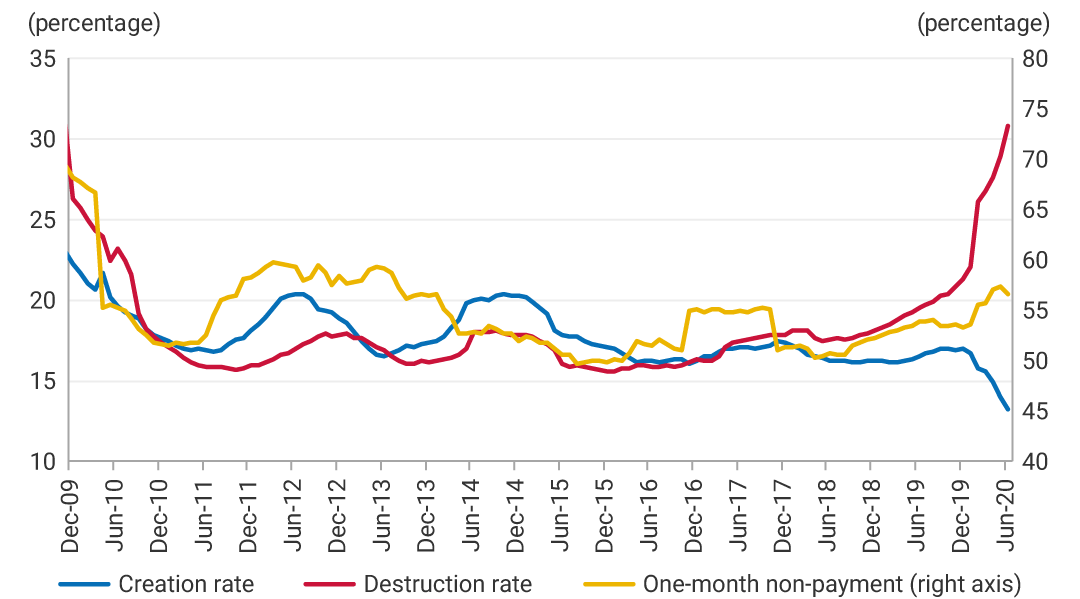
Source: Ministry of Health and Social Protection; calculations by Banco de la República.
Given that the last observation in the sample may include institutions that fell behind in social security payments during June 2020 but have not necessarily been destroyed, we calculated the rate of firms falling behind in their social security payments in each month of analysis, finding that the increase in firm destruction is maintained, even when controlling for this effect.
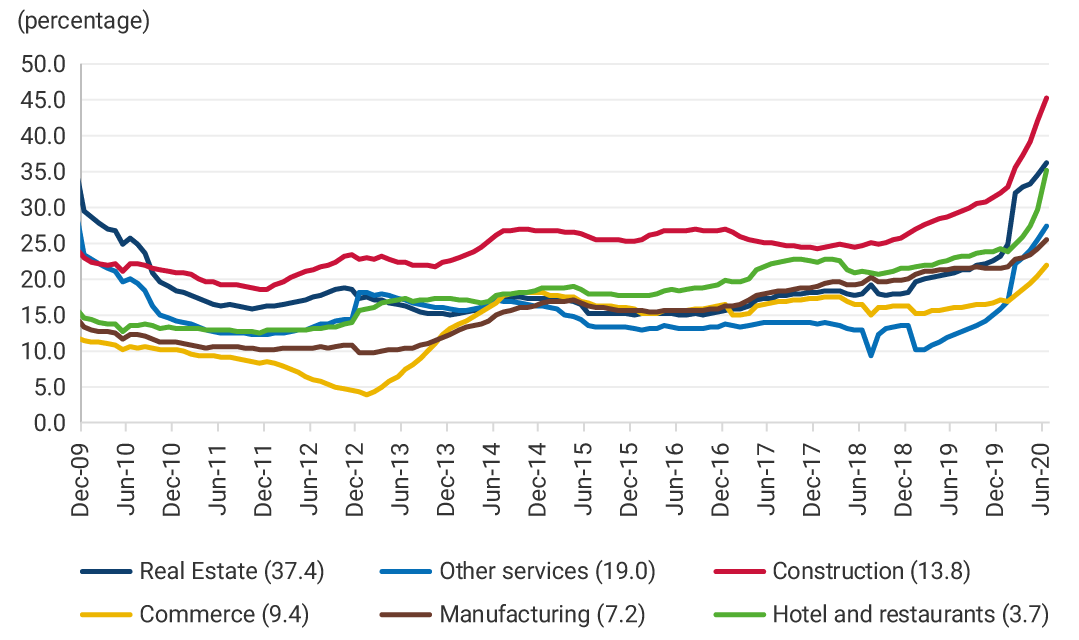
By economic sector, construction and mining are those where a higher percentage of companies tends to be destroyed (Graph 2). In the case of construction, as a consequence of the health crisis, its rate of business destruction grew 16.2 percentage points as of June 2020, reaching its peak. As for mining, its destruction rate increased in 2019; however, the crisis did not seem to have an effect, and in 2020 it decreased. The real estate and hotel and restaurant sectors stand out as their sensitivity to the measures of temporary and total closures of the economy has resulted in historical destruction rates of 36.0% and 35.0%, respectively.
Graph 2. Analysis of Destruction by Sector
Panel A. Six main sectors
Panel B. The rest
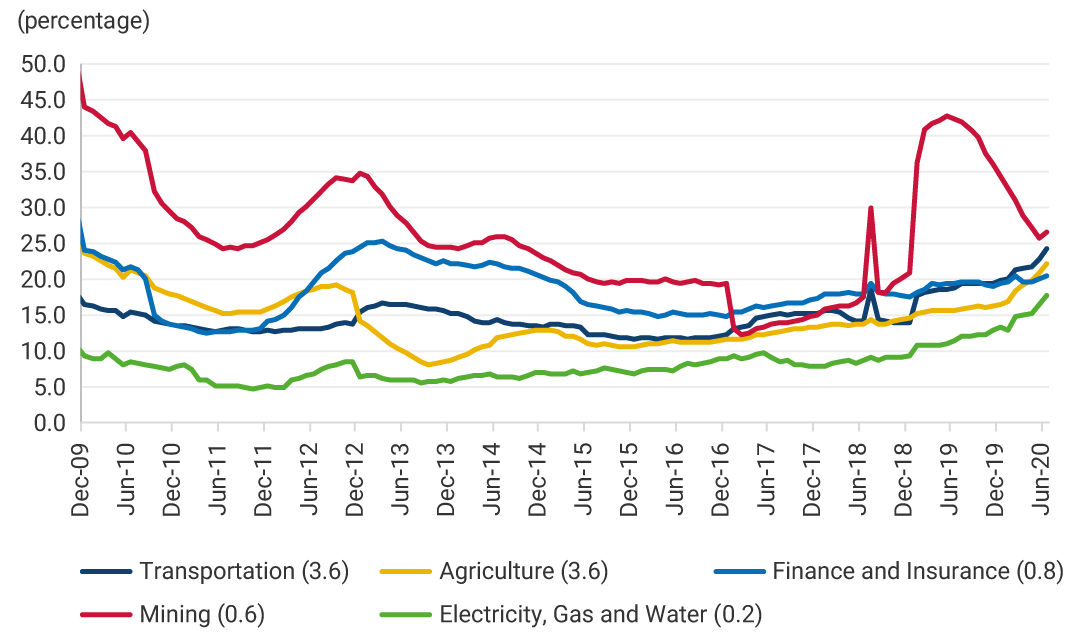
Note: Parentheses next to the legends exhibit the percentage of the number of firms destroyed by economic sector in June 2020.
The analysis by firm size exhibits that, for the period analyzed, firm creation and destruction rates are consistently higher for smaller firms (Graph 3, Panel A). On the other hand, the economic situation affected the creation of firms uniformly for all sizes; however, it is inferred that micro and small firms have suffered the consequences of the pandemic to a greater extent since they exhibited significant increases in their destruction rate (Graph 3, Panel B). In the last year of the analysis, 757,754 jobs disappeared, 81.0% belonging to micro and small businesses.
Graph 3. Analysis by Size
Panel A. Firm creation
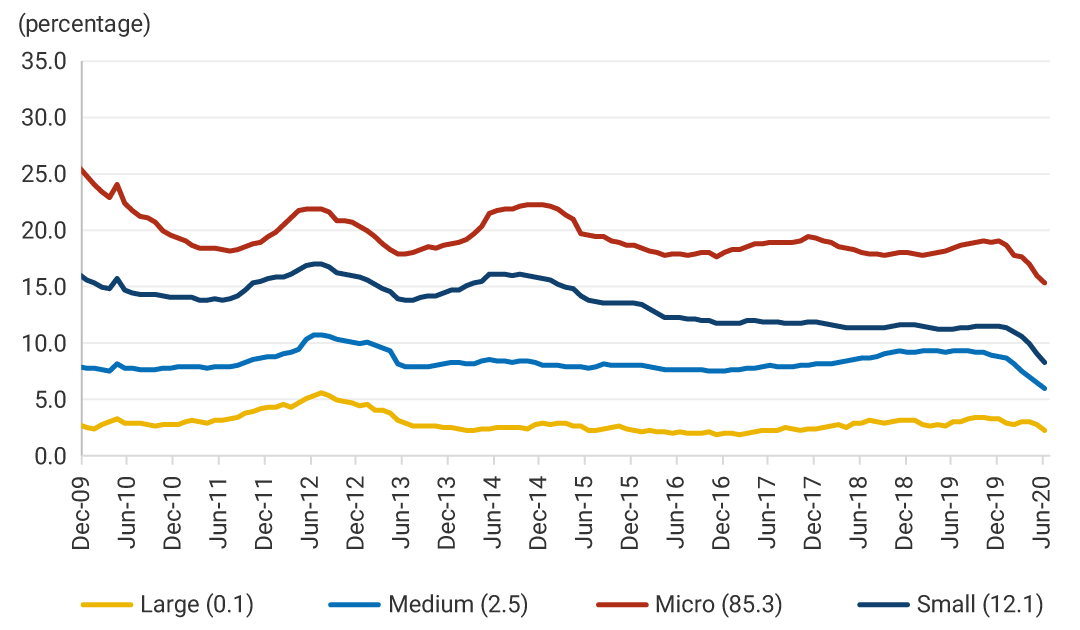
Panel B. Firm destruction
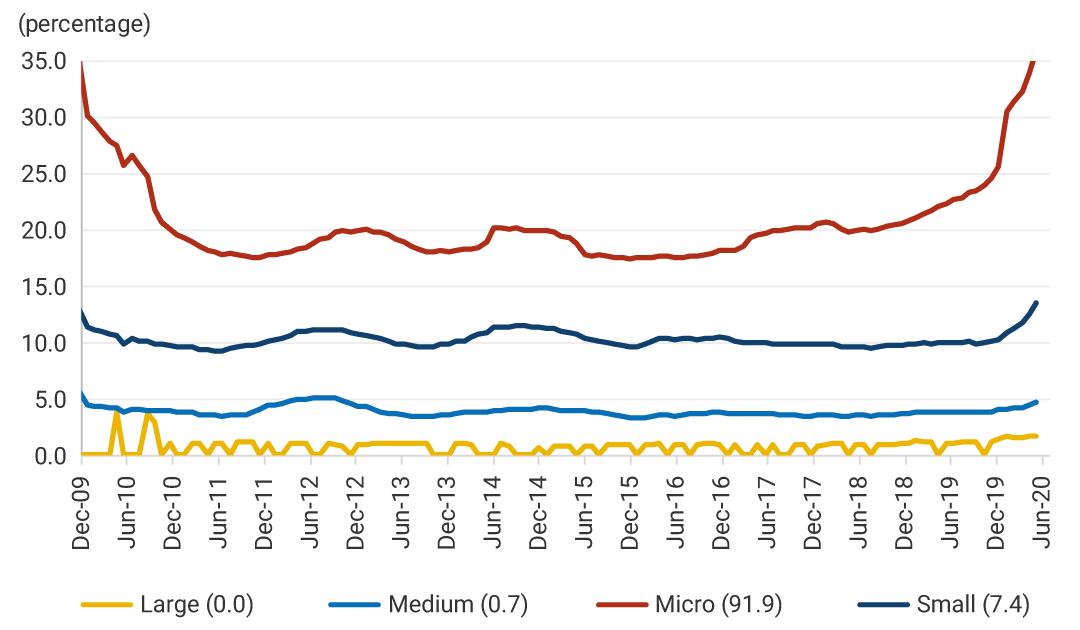
Note: Parentheses next to the legends exhibit the percentage of the number of firms created by size in June 2020.
Source: Ministry of Health and Social Protection; calculations by Banco de la República.
The results presented suggest that between 2019 and 2020, in the context of the health crisis caused by COVID-19, the rate of firm creation has decreased at the aggregate level and for all firm sizes. In turn, the destruction rate has increased outpacing the creation rate since 2017, and has recently accelerated, especially for micro and small businesses, and in the construction, real estate, hotel, and restaurant sectors.