Report on the Evolution of the Balance of Payments and the International Investment Position – Third Quarter of 2025
The quarterly report on the performance of Colombia’s balance of payments and the international investment position outlines the main results for the country’s current and financial accounts, as well as the evolution of their items.
1. Overall Results for the Balance of Payments
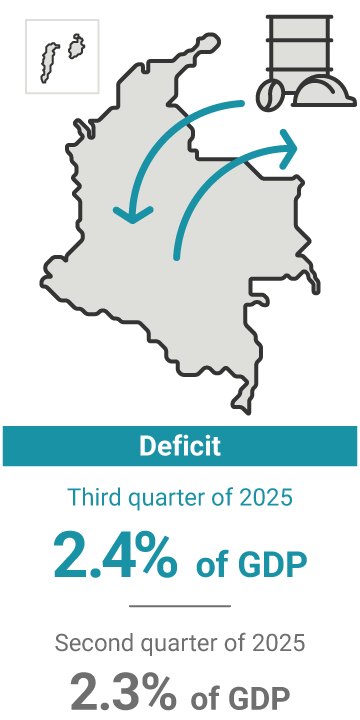
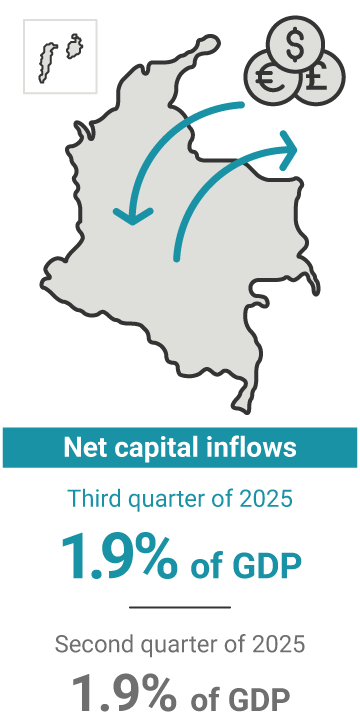
During the third quarter of 2025, Colombia’s current account of the balance of payments registered a USD 2,853 million (m) deficit, equivalent to 2.4% of the quarterly Gross Domestic Product (GDP). In turn, the financial account, including the variation in foreign reserves (USD 534 m), recorded net capital inflows for USD 2,232 m (1.9% of quarterly GDP). Errors and omissions were estimated at USD 621 m.
By components, the current account deficit (USD 2,853 m) in the third quarter of 2025 was driven by the trade balance of goods deficit amounting to USD 4,307 m and net primary income outflows of USD 3,170 m. These results were partially offset by net income from current transfers of USD 4,213 m and the trade balance of services surplus of USD 141 m (Graph 1).
Graph 1. Components of Colombia’s Current Account of the Balance of Payments
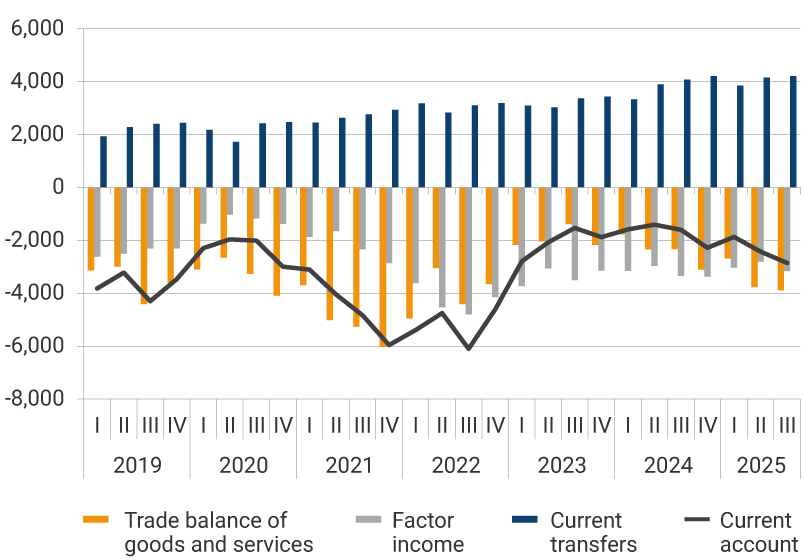
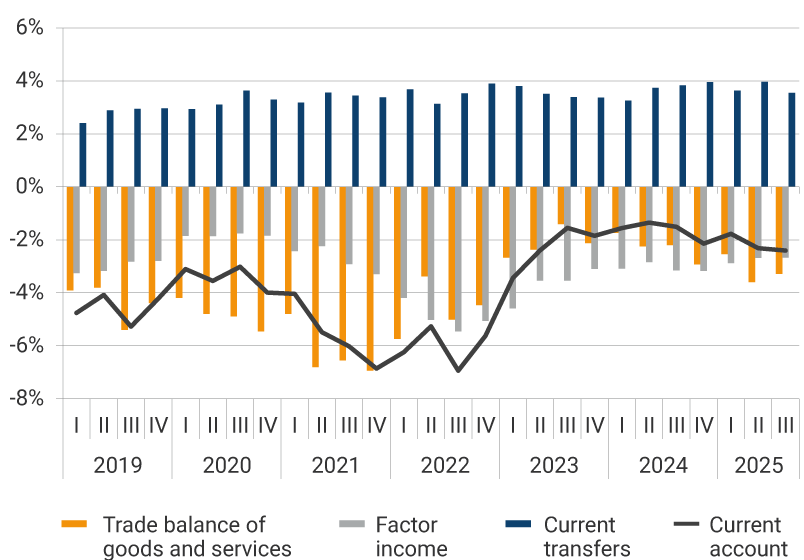
Source: Banco de la República (the Central Bank of Colombia)
Regarding the financial account for the third quarter of 2025, net capital inflows are estimated at USD 2,232 m, corresponding to foreign capital inflows (USD 10,377 m), Colombian capital outflows (USD 8,009 m), payments from non-residents to residents for gains in financial derivatives transactions (USD 398 m), and the increase in foreign reserves due to balance of payments transactions (USD 534 m) (Graph 2).
Graph 2. Components of the Financial Account of Colombia’s Balance of Payments
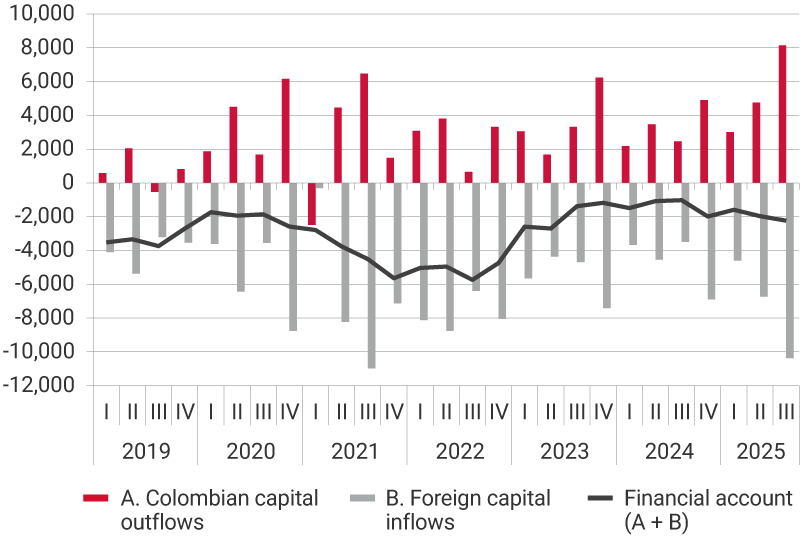
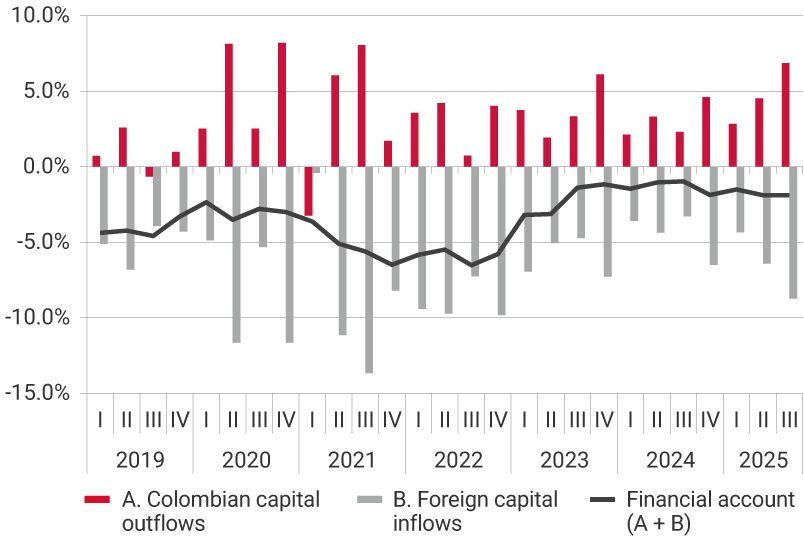
Note: According to the Sixth Edition of the International Monetary Fund’s Balance of Payments Manual, the financial account is presented with the same sign as the current account. For example, if the current account is in deficit, the financial account is negative. This indicates that the economy is resorting to external financing and/or liquidating its external assets to finance its excess current expenditure..
Source: Banco de la República
2. Quarterly and Annual Evolution of the Current and Financial Accounts of Colombia’s Balance of Payments
(a) Current Account
The estimated current account deficit for the third quarter of 2025 (USD 2,853 m, 2.4% of GDP) widened by USD 427 m compared to the immediately preceding quarter. This increase was driven by a larger deficit in the trade balance of goods and higher net primary income outflows, partially offset by the shift from a deficit to a surplus in the balance of services and by an increase in the surplus from current transfers (Graph 1).
For the January-September period of 2025, the current account deficit (USD 7,152 m, 2.2% of GDP) was higher by USD 2,552 m compared to the same period in 2024. This performance was explained by the widening of the trade balance of goods deficit, partially offset by an increase in net income from current transfers, lower primary income net outflows, and the shift from a deficit to a surplus in the trade balance of services.
(b) Financial Account
Net capital inflows of USD 2,232 m (1.9% of GDP) recorded in the financial account during the third quarter of 2025 increased by USD 262 m compared to the immediately preceding quarter. This result was explained by net disbursements of loans and other foreign credits, higher net income from portfolio and direct investments, partially offset by higher deposits abroad.
For the January-September period of 2025, the financial account (USD 5,792 m, 1.8% of GDP) recorded higher net inflows of USD 2,203 m compared to the same period in 2024. This dynamic was mainly explained by higher net income from portfolio investments, partially offset by higher deposits abroad, higher net amortizations of loans and other foreign credits, as well as lower net income from direct investments.
3. International Investment Position (IIP)
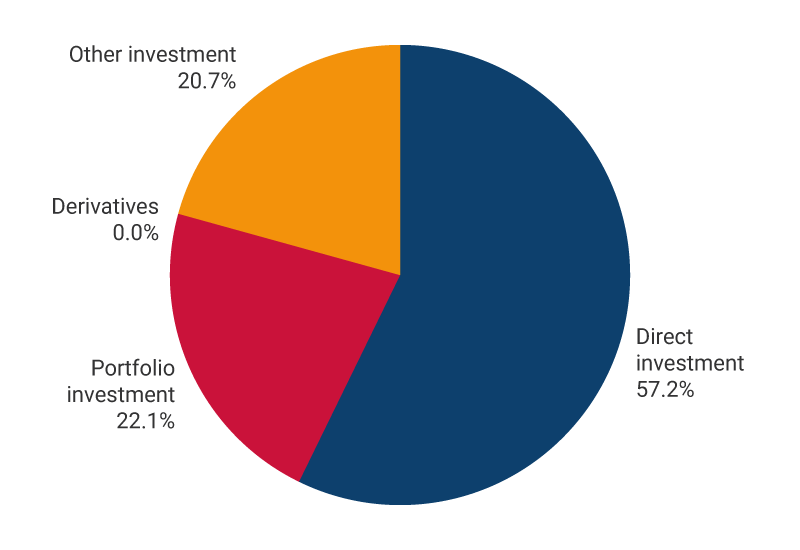
As of the end of September 2025, Colombia held a negative net international investment position of USD 194,546 m (46.0% of annual GDP), resulting from assets of USD 298,543 m (70.6% of annual GDP) and liabilities of USD 493,089 m (116.6% of annual GDP). Of the total asset balance, 37.3% corresponds to portfolio investments, 27.2% to Colombian direct investment abroad, 22.1% to foreign reserves, and the remaining 13.4% to other assets such as loans, other foreign credits, deposits abroad, and financial derivatives. Liabilities are broken down into 57.2% foreign direct investment, 20.7% other types of investment (where external loans stand out), and 22.1% portfolio investments.
Graph 3. International Investment Position as of September 2025 (USD 194,546 m, 46.0% of GDP 1)
USD 298,543 m
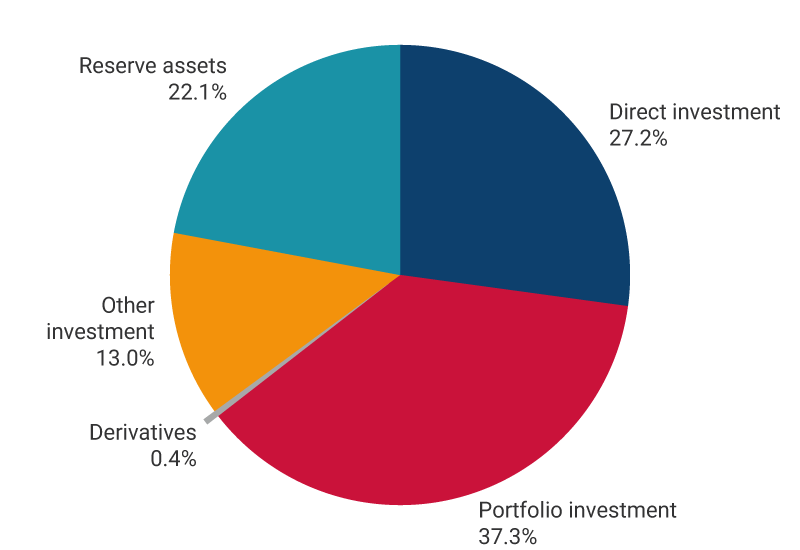
USD 493,089 m
1 The GDP figure in US dollars corresponds to the sum of the last four quarters.
Report on Evolution of the Balance of Payments and International Investment Position (Complete issues - available since 2023)
This report describes the main results of the quarterly and annual evolution of the country's balance of payments.