The COVID-19 pandemic significantly altered the way merchants do business. Preventive confinement, health restrictions and fear of contagion forced businesses to look for other ways of operating through home-based services, online commerce and the acceptance of different electronic payment instruments and channels as alternatives to cash.
As evidenced by the findings of the payment survey conducted by Banco de la República at the end of 2020 and reported in a study by Carlos Arango, Rocío Betancourt, Manuela Restrepo and Germán Zuluaga, who are researchers at Banco de la República, 50% of the businesses surveyed have adopted some sort of electronic payment instrument or channel. Moreover, 26.1% of the adoption of these services was a consequence of the pandemic. Also, 51.4% of the businesses surveyed reported an increase in their electronic sales compared to cash sales during this period, with similar trends in all sectors (Graph 1).
Graph 1. Change in Electronic versus Cash Payments during the Pandemic, by Business Sector (Percentage)
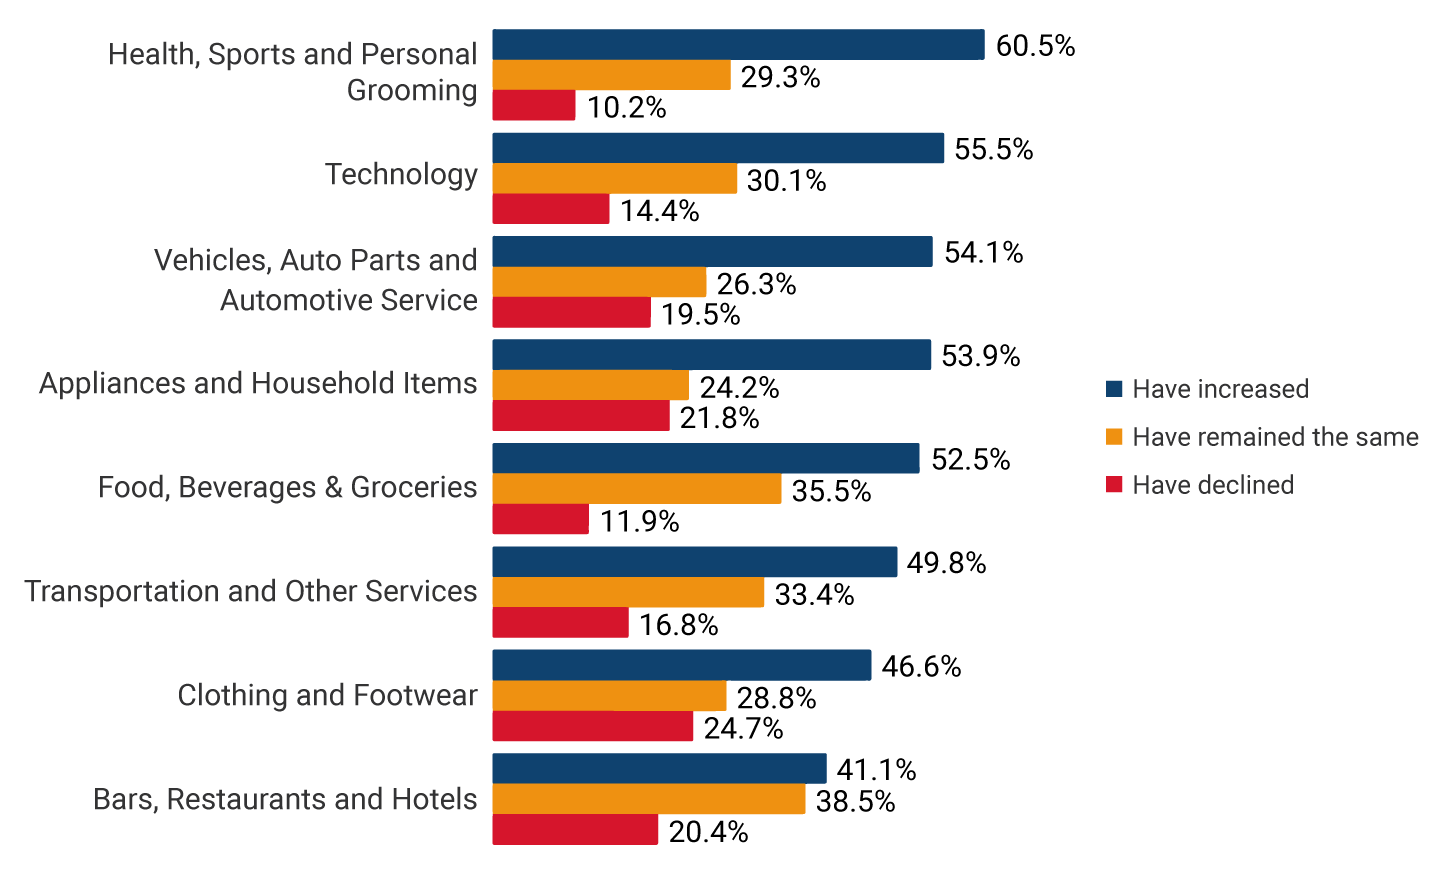
Source: Borradores de Economía, 1180, Banco de la República.
Less use of cash is also evident when the ratio of cash withdrawals (advances plus card withdrawals) to private consumption is calculated. In this case, the quarterly average went from 30.2% in the 2015-2019 period to 24.6% in the 2020-2021 pandemic period (Graph 2).
Graph 2. Cash Withdrawals and Advances as a Share of Private Consumption
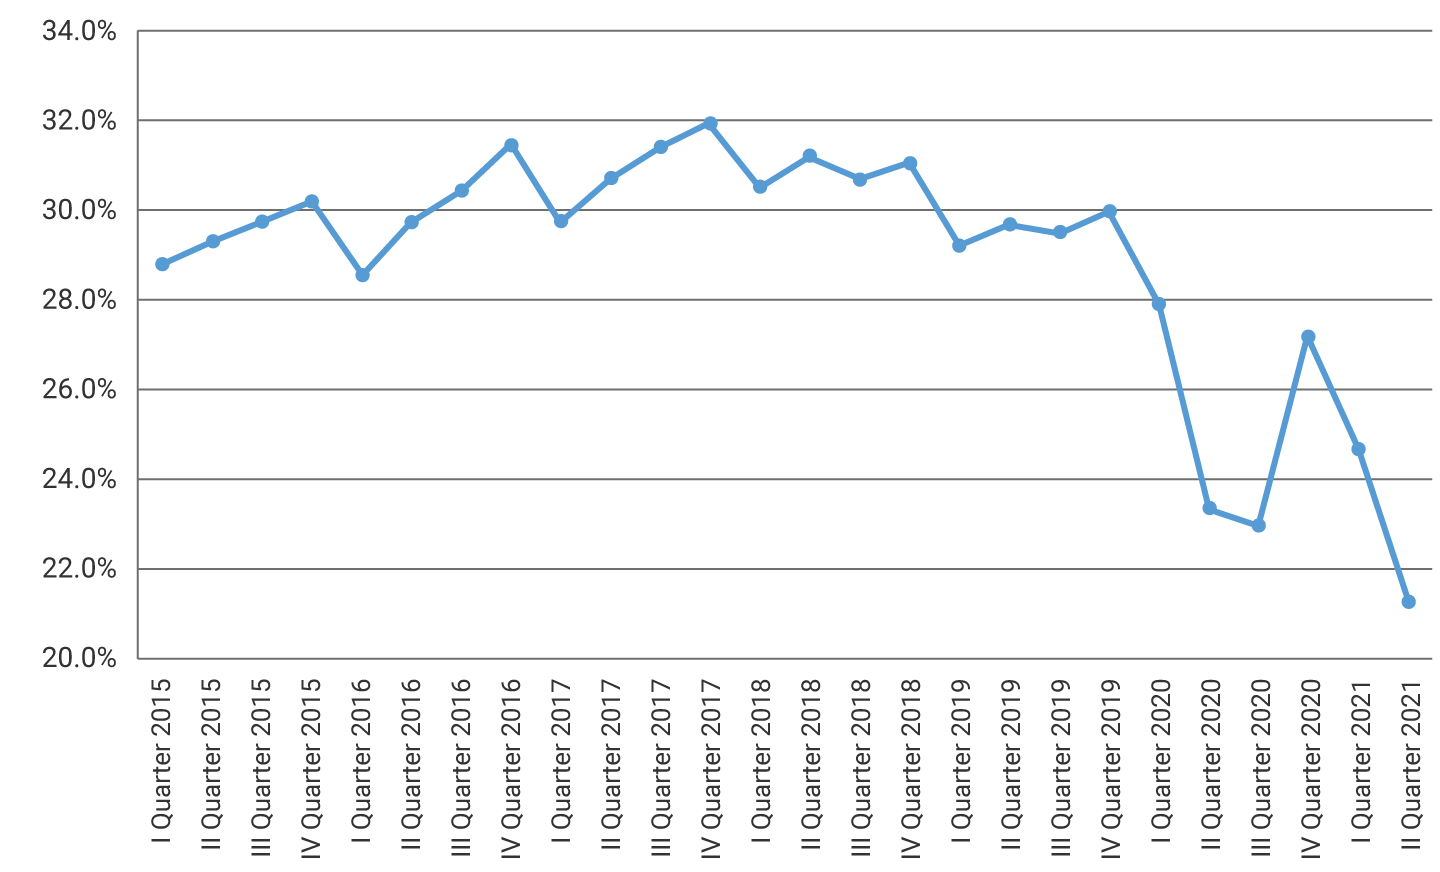
Source: Calculations based on figures from the Office of the Financial Superintendent of Colombia and from DANE.
The leap in the acceptance of electronic payments, however, revealed an important reality about the supply of these services. The digital needs created by the pandemic have been supplied to a large extent by electronic instruments and channels other than those associated with payment cards.
The survey shows 41.1% of the adoption of transfers through mobile applications 1 is attributable to the pandemic, as opposed to less than 22% in the case of cards (Graph 3). Also, 60.1% of the electronic channels and instruments adopted during the pandemic are associated with electronic transfers (via mobile applications or bank websites) and not cards. These consequences are due partly to the fact that sales through cards imply the payment of commissions and withholding taxes (Retefuente and Reteica), which do not necessarily occur in the same way through alternative payment mechanisms.
Graph 3. Merchants that Adopted the Following Payment Channels Due to the Pandemic (Percentage).
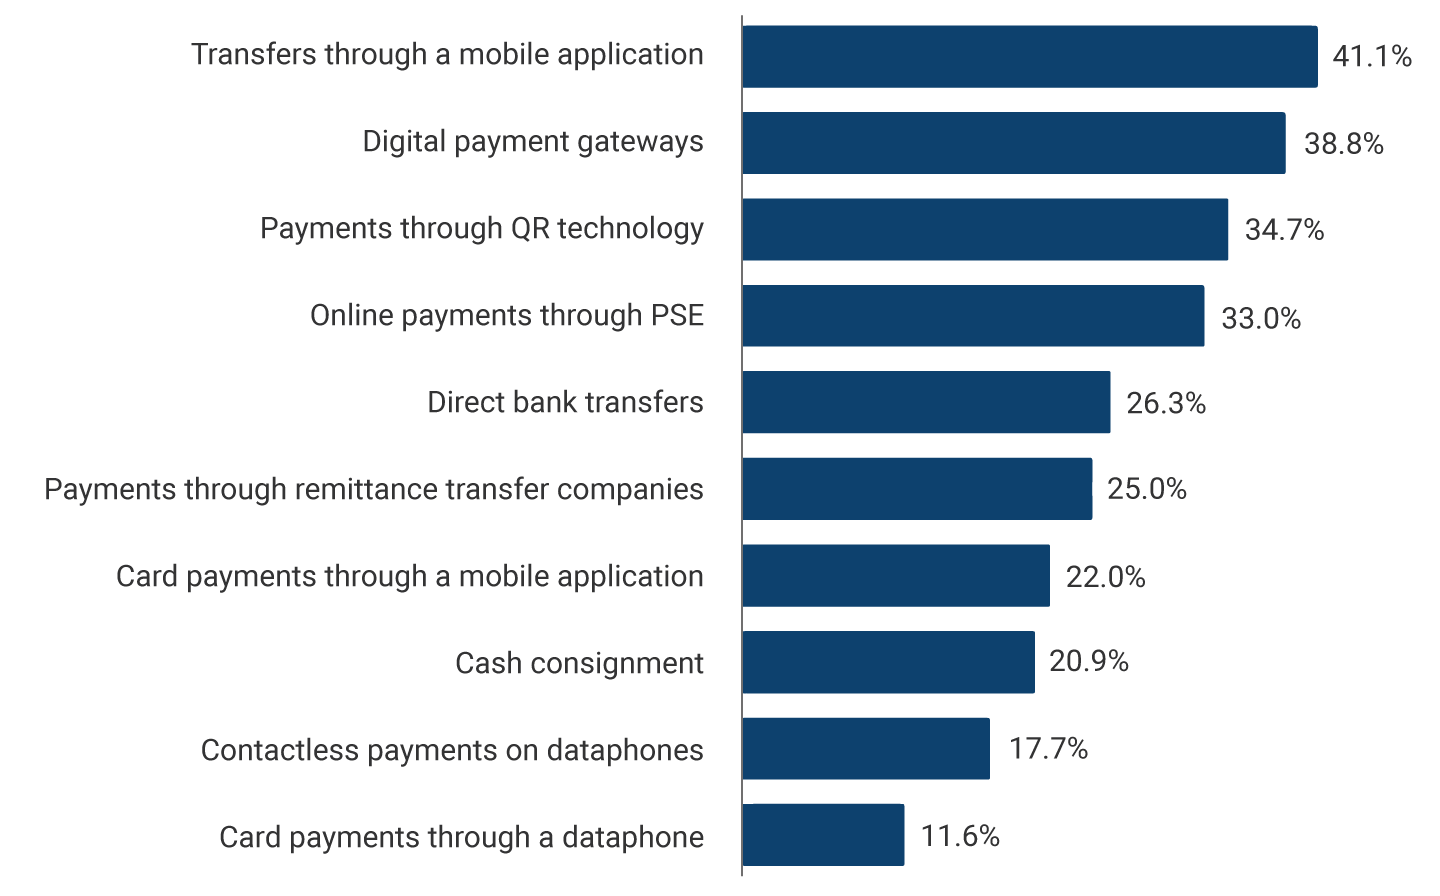
Note: Expanded sample. Merchants who adopted the channel report they did so as a result of the pandemic.
Source: Borradores de Economía 1180, Banco de la República.
The high costs of cards are a major barrier to their adoption. In fact, only one-third of the merchants surveyed consider card transactions to be less costly than cash transactions, while 67% consider sales through electronic transfers via mobile applications to be less costly than those made in cash (Graph 4). However, two-thirds of the merchants surveyed recognize that accepting them could increase their sales.
Graph 4. Views on the Features of Different Payment Instruments (Percentage)
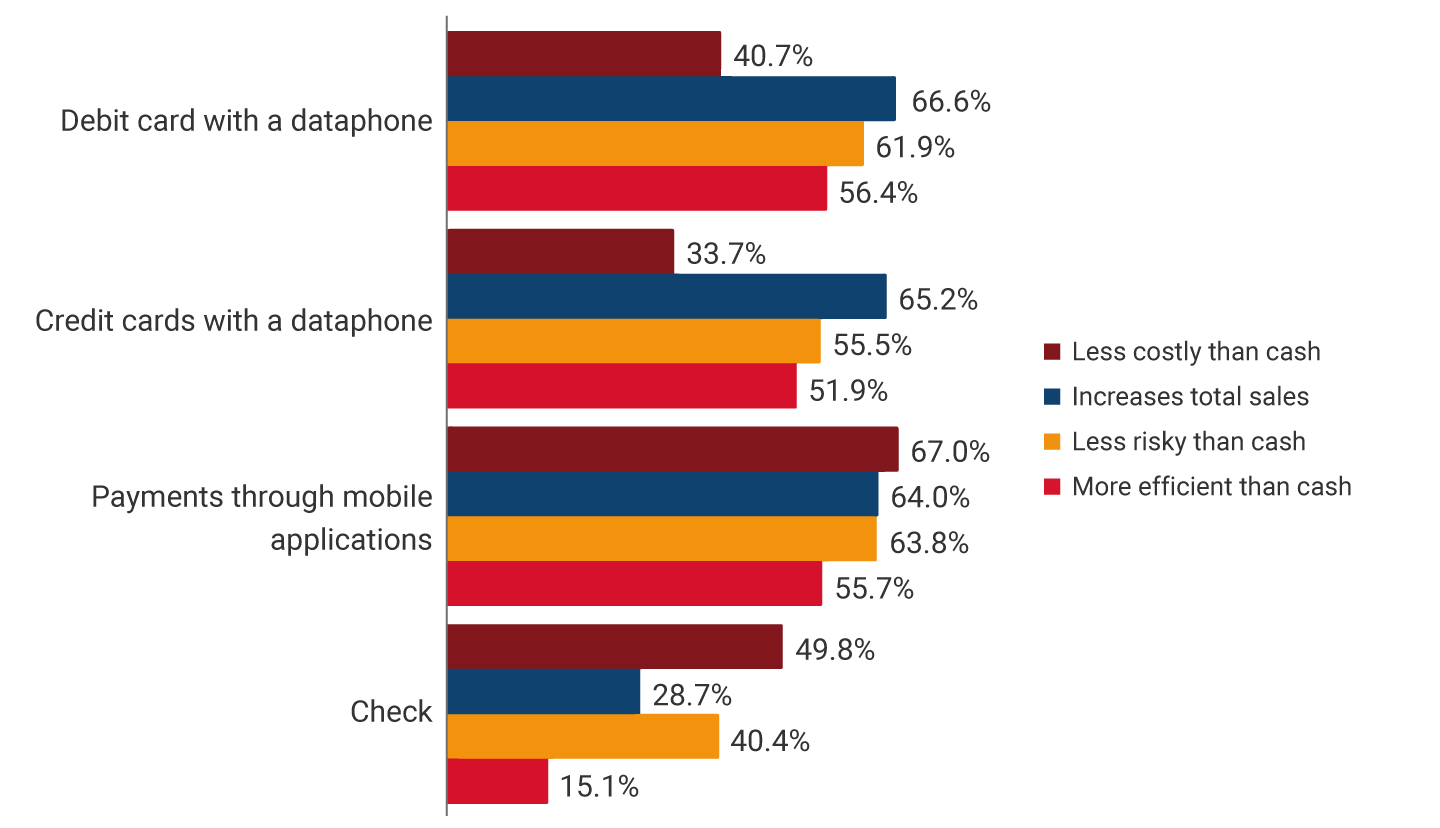
Note: Expanded sample. Differences are statistically significant at 1.0%.
Source: Borradores de Economía 1180, Banco de la República.
In a complementary study, Carlos Arango, Rocio Betancourt and Manuela Restrepo find that debit and credit cards are 2.7 times more expensive than cash, in the case of Colombia, and their costs are relatively higher in the case of micro- merchants. This is due mainly to the fact that commissions account for more than two thirds of their processing costs. In addition, the authors show the fees currently charged by the industry are above the levels considered optimal for the welfare of end users. Therefore, the 2020 survey unsurprisingly reveals that more than 60% of merchants who accept these payment instruments use strategies such as cash discounts and minimum amounts or surcharges for card payments as an incentive to be paid in cash (Graph 5).
Graph 5: Merchants Using Strategies to Encourage Cash Payments, by Size (Percentage)
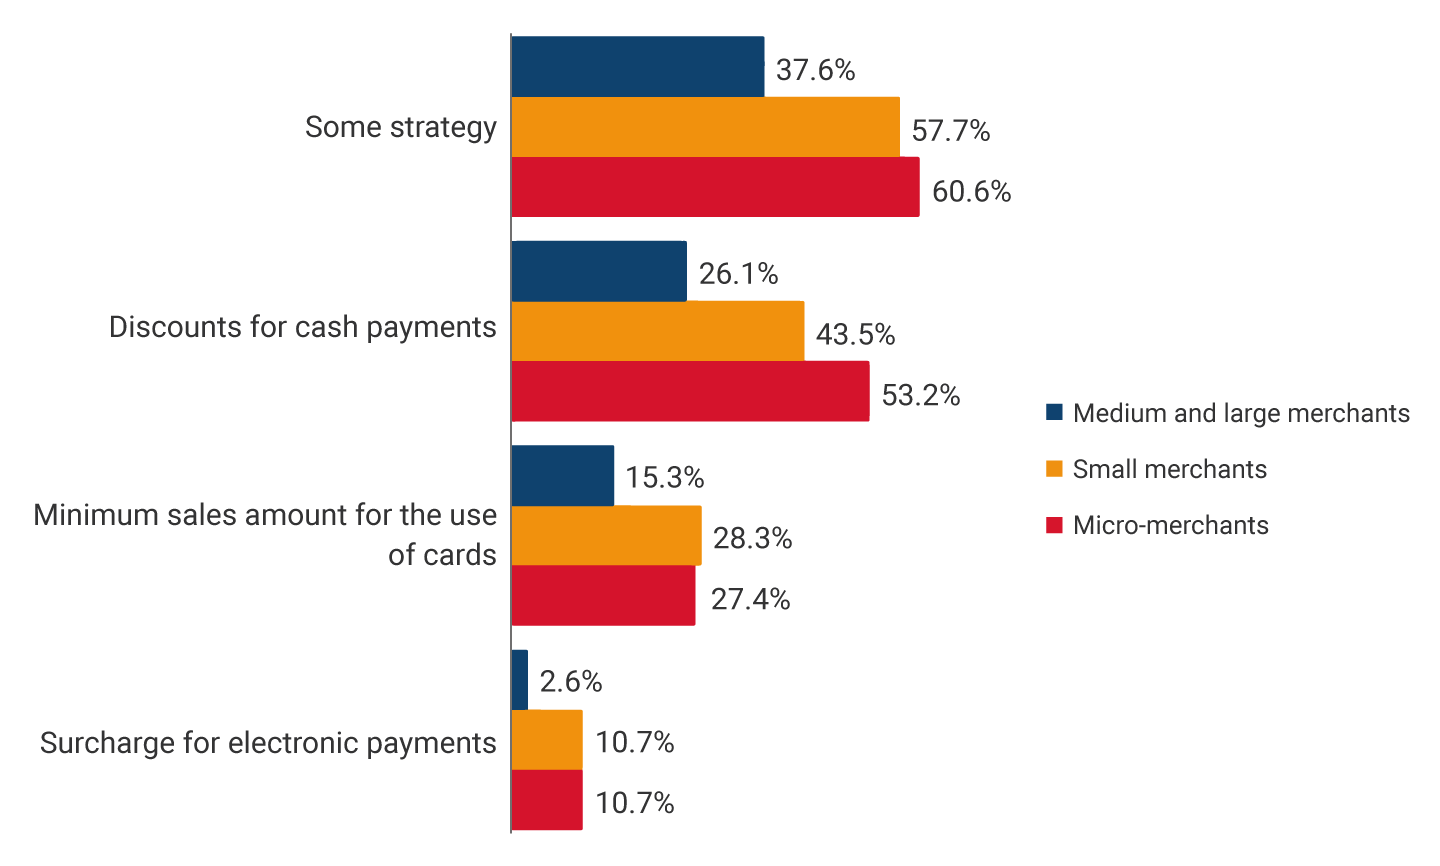
Note: Percentage calculated with respect to merchants who accept debit and credit cards.
Source: Borradores de Economía 1180, Banco de la República.
The proliferation of electronic payment options as an alternative to cards is a positive sign that technological advances and market incentives are favoring the entry of providers of payment services that are less costly than those offered by traditional schemes. However, the still limited acceptance of electronic payments and the lack of integration among the new providers of these services mean that Colombians continue to prefer payment in cash, which accounts for 78.5% of merchant sales (Graph 6). Therefore, it is appropriate to continue to monitor developments in the acceptance and use of electronic payments and consolidation of the reduction in the use of cash prompted by the pandemic.
Graph 6. Sales in Pesos and Number of Transactions by Payment Instrument (Percentage)
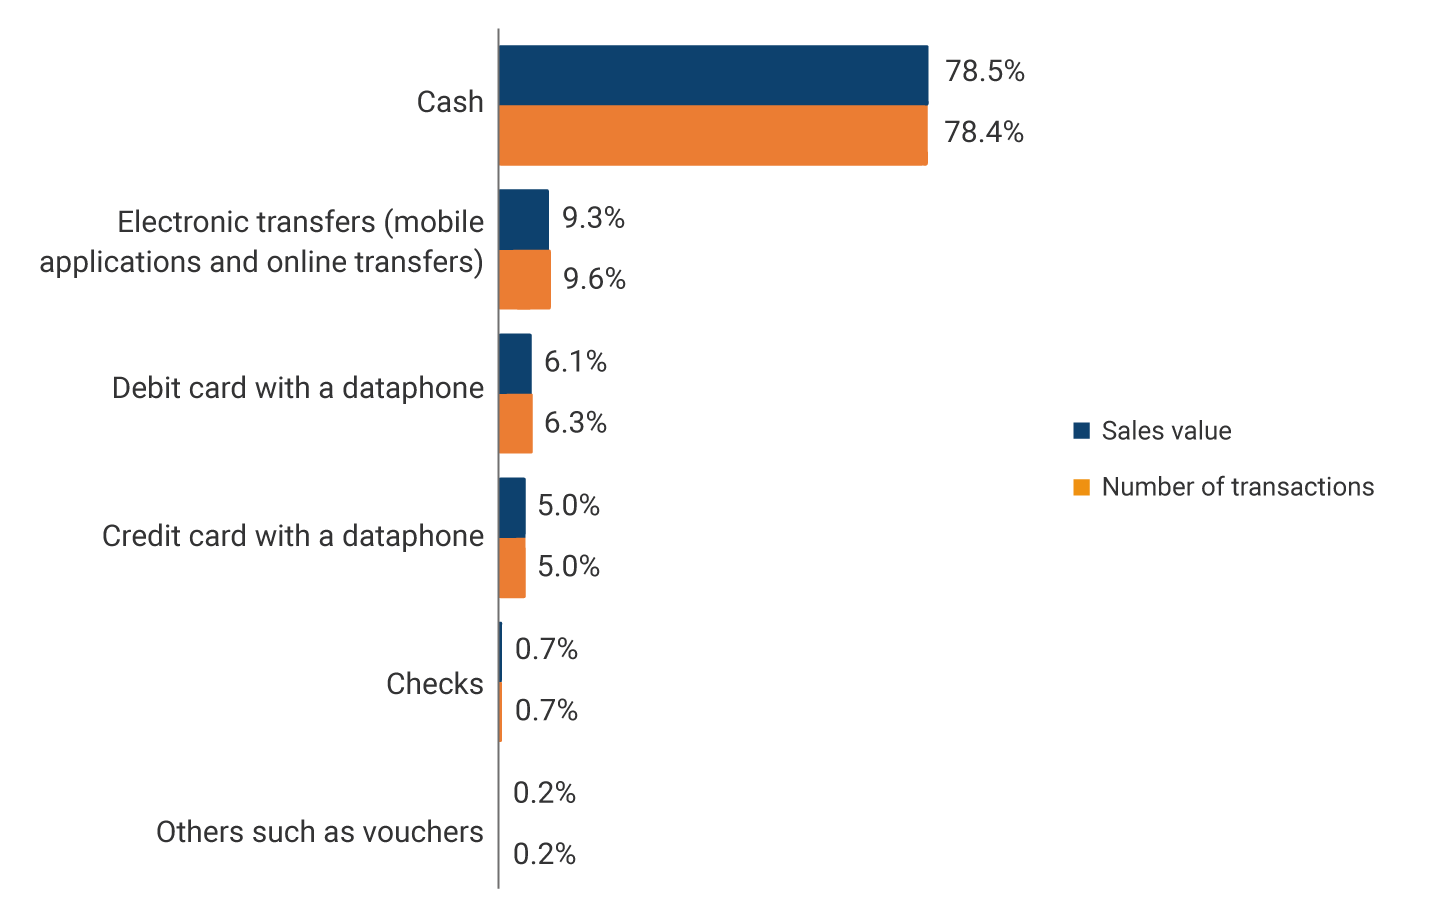
Note: Expanded sample. Differences between sizes are significant at a<0.01.
Source: Serie Borradores de Economía 1180, Banco de la República.
1. The survey refers to transfers between accounts through mobile apps such as Daviplata, Nequi or Movii.