2019: Consolidating Recovery - Governor’s Report March 2019
| Full Report | eVersion | |
Versión en español |


| INTRODUCTION |
|
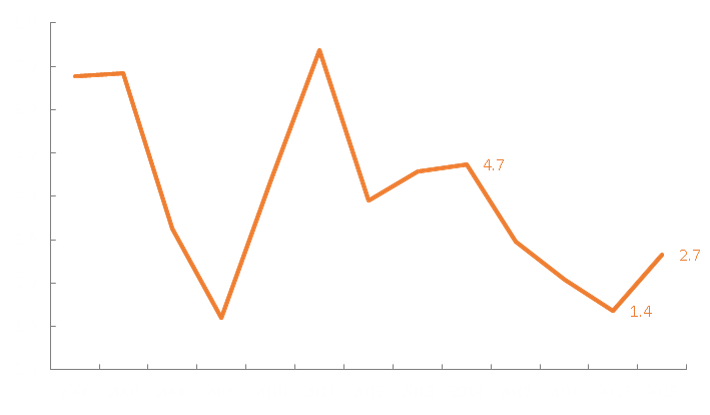
Colombia’s economy expanded by 2.7% in 2018, gaining momentum after a period of deceleration in which the annual growth rate fell from 4.7% in 2014 to 1.4% in 2017 (Graph 1). While growth was still below potential (estimated around 3.3%), the uptick in 2018 suggests the groundwork for Colombia’s economic recovery has been laid. |
|
Graph 1 |
||
 |
||
| Source: DANE. Note: GDP seasonally adjusted and corrected for calendar effects (2015 base year). |
| 1. Sources of Growth | |
|
The increase in economic activity seen in 2018 was driven by domestic demand, which grew at an annual rate of 3.8%, well above the 1.2% registered in 2017. Household and public sector consumption provided the basis for this resurgence, alongside a strong rebound in gross capital formation in the second half of the year (Table 1) |
|
Table 1 (annual variation %) |
|||||||||||||||
| 2017 | 2018 | 2018 | |||||||||||||
| Full Year |
QI | QII | QIII | QIV | Full Year |
||||||||||
| Total Consumption | 2.4 | 3.9 | 4.4 | 3.8 | 3.6 | 3.9 | |||||||||
| Household consumption | 2.1 | 3.4 | 3.9 | 3.6 | 3.3 | 3.5 | |||||||||
| Non-durable Goods | 3.1 | 4.4 | 5.2 | 3.9 | 3.6 | 4.2 | |||||||||
| Semi-durable Goods | 0.8 | 3.0 | 5.1 | 5.3 | 4.4 | 4.4 | |||||||||
| Durable goods | -4.3 | 6.4 | 8.1 | 5.3 | 5.6 | 6.3 | |||||||||
| Services | 2.7 | 2.8 | 2.6 | 2.4 | 2.5 | 2.6 | |||||||||
| Final public sector consumption | 3.8 | 6.0 | 5.9 | 6.2 | 5.4 | 5.9 | |||||||||
| Gross Capital Formation | -3.2 | -2.3 | -1.8 | 8.7 | 9.9 | 3.5 | |||||||||
| Gross Fixed capital formation | 1.9 | -0.9 | -2.8 | 2.9 | 5.4 | 1.1 | |||||||||
| Housing | -1.9 | -4.8 | -1.0 | 0.9 | 5.8 | 0.0 | |||||||||
| Other Buildings and structures | 4.6 | -2.2 | -2.6 | 1.5 | 9.5 | 1.5 | |||||||||
| Machinery and equipment | 1.4 | 8.8 | -0.8 | 0.2 | -3.8 | 1.0 | |||||||||
| Cultivated biological resources | 0.3 | -2.7 | 2.0 | 7.6 | -2.6 | 0.9 | |||||||||
| Intellectual property products | 2.5 | 4.0 | 5.3 | 4.7 | 4.1 | 4.5 | |||||||||
| Internal Demand | 1.2 | 3.5 | 3.3 | 4.0 | 4.5 | 3.8 | |||||||||
| Total Exports | 2.5 | -0.2 | 0.4 | 1.6 | 3.1 | 1.2 | |||||||||
| Total Imports | 1.2 | 0.3 | 8.3 | 7.9 | 15.6 | 8.0 | |||||||||
| GROSS DOMESTIC PRODUCT (GDP) | 1.4 | 2.2 | 2.6 | 2.9 | 2.9 | 2.7 | |||||||||
|
Source: DANE; Calculations by Banco de la República (Central Bank of Colombia). |
|||||||||||||||
|
Several factors contributed to the 3.5% expansion in household consumption seen in 2018. First, the effects of an increase in the VAT from 16% to 19%, approved by a 2016 tax reform, began to wane. At the same time, the inflation rate converged to the target rate, and the Central Bank maintained a moderately expansive monetary policy. This policy led to a reduction in interest rates on consumer credit and contributed to a positive spending and loan environment, especially in the second half of the year (Graph 2). |
|
|
Graph 2 |
||
 |
||
| Source: Office of the Financial Superintendent of Colombia (Superintendencia Financiera de Colombia). |
|
Public sector consumption increased by 5.9% in 2018, higher than the 3.8% growth registered in 2017. This was in part due to election-season spending and costs associated with a national census.
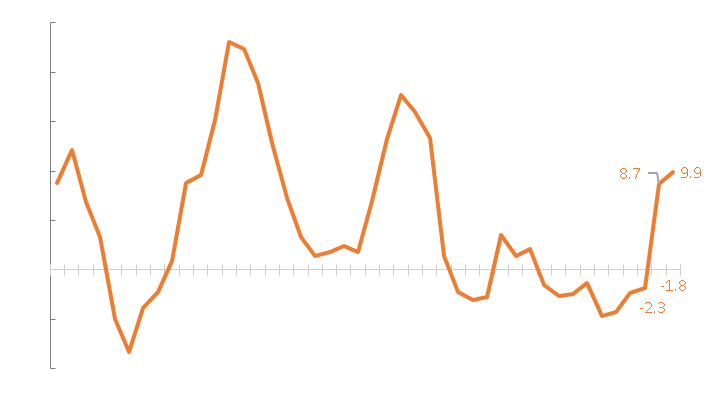
Gross capital formation grew 3.5% in 2018, although its performance over the course of the year was inconsistent. The first two quarters saw contractions of 2.3% and 1.8%, respectively. These were due primarily to a rough patch in the construction sector, both in home-building and public works, associated with excess housing supply, uncertainty surrounding the election, and administrative and institutional problems that delayed major highway construction projects throughout the country. Gross capital formation turned around in the second half of the year, however, growing by 8.7% and 9.9% in the third and fourth quarters, respectively (Graph 3). This was the result of a reduction in excess housing, progress on the highway projects, and an increase in business confidence once the elections had concluded. |
|
|
Graph 3 |
||
 |
||
| Source: DANE. |
|
Acceleration in domestic demand was not fully reflected in economic growth in 2018, as net external demand (exports minus imports) weighed negatively on GDP. Real growth in imports (8.0%) was faster than that of exports (1.2%), with imports of capital goods (11.4%) and raw industrial and agricultural materials (11.5%) proving especially dynamic.
On the supply side, the increase in economic activity in 2018 was reflected in positive growth across all sectors except mining, which saw a slight contraction of 0.8% compared to 2017 (Table 2). Strong growth in professional, scientific and technical activities (5.0%) and in public administration and defense, health and education (4.1%) merit special attention. The commercial, repairs, transportation and housing sectors, as well as the information and communications technology sector, all grew at a 3.1% annual rate, higher than in 2017. Manufacturing also rebounded, growing at 2.0% in 2018 compared to a 1.8% contraction in 2017. Agriculture and livestock grew by 2.0%, less than in 2017 (5.5%), due to lower production in coffee and other crops as a result of adverse weather conditions. Meanwhile, construction saw low but positive growth (0.3%), a contrast to the 2.0% contraction seen in the sector in 2017. Growth in this sector included a noteworthy rebound in public works in the last quarter of the year (7.8%). |
|
|
Table2 (annual variation %) |
||||||||||||
| 2017 | 2018 | 2018 | ||||||||||
| Full Year |
QI |
QII |
QIII |
QIV |
Full Year |
|||||||
| Agriculture, livestock, hunting and fishing | 5.5 | 2.2 | 3.7 | 1.3 | 0.8 | 2.0 | ||||||
|
Mines and quarries |
-5.7 | -3.5 | -3.2 | 2.7 | 1.0 | -0.8 | ||||||
| Manufacturing industry | -1.8 | 0.1 | 2.5 | 2.8 | 2.6 | 2.0 | ||||||
| Electricity, gas and water | 2.9 | 2.9 | 2.7 | 2.6 | 2.7 | 2.7 | ||||||
| Construction | -2.0 | -4.3 | -5.2 | 5.3 | 5.6 | 0.3 | ||||||
| Buildings | -5.2 | 0.1 | -5.6 | 5.7 | 3.9 | 1.0 | ||||||
| Public Works | 6.5 | -3.7 | -3.8 | -2.9 | 7.8 | -0.6 | ||||||
| Specialized construction activities | -4.0 | -1.0 | -5.7 | 2.1 | 1.0 | -0.9 | ||||||
|
Commerce, repairs, transportation and lodging |
1.9 | 3.1 | 3.2 | 3.2 | 3.0 | 3.1 | ||||||
| Information and communications | -0.2 | 0.6 | 3.1 | 5.5 | 3.2 | 3.1 | ||||||
| Financial activities and insurance | 5.4 | 4.7 | 3.8 | 1.6 | 2.3 | 3.1 | ||||||
| Property activities | 3.1 | 2.2 | 2.0 | 1.9 | 1.8 | 2.0 | ||||||
| Professional, scientific and technical activities | 1.3 | 7.2 | 6.1 | 3.4 | 3.4 | 5.0 | ||||||
| Public and defense activities, health and education | 3.5 | 5.2 | 4.2 | 3.5 | 3.7 | 4.1 | ||||||
| Artistic, educational and recreational activities | 2.2 | 0.7 | 1.6 | 0.9 | 2.5 | 1.4 | ||||||
| Subtotal value added | 1.4 | 2.4 | 2.1 | 2.9 | 2.5 | 2.5 | ||||||
| Taxes minus subsidies | 1.1 | 2.1 | 3.1 | 2.6 | 2.5 | 2.6 | ||||||
| Gross Domestic Product (GDP) | 1.4 | 2.2 | 2.6 | 2.9 | 2.9 | 2.7 | ||||||
|
Source: DANE; Calculations by the Banco de la República (Central Bank of Colombia). |
||||||||||||
| 2.Inflation | |
|
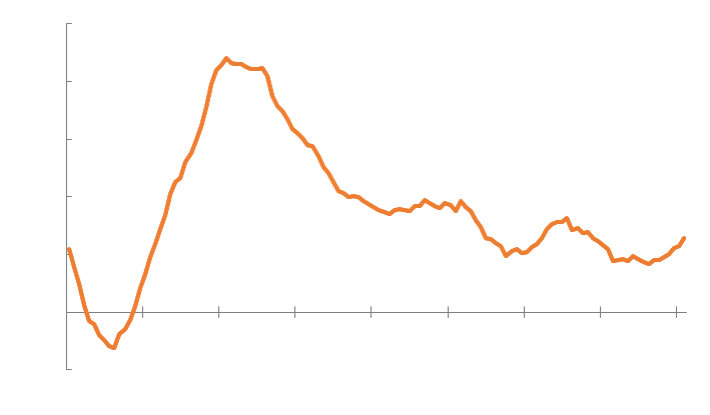
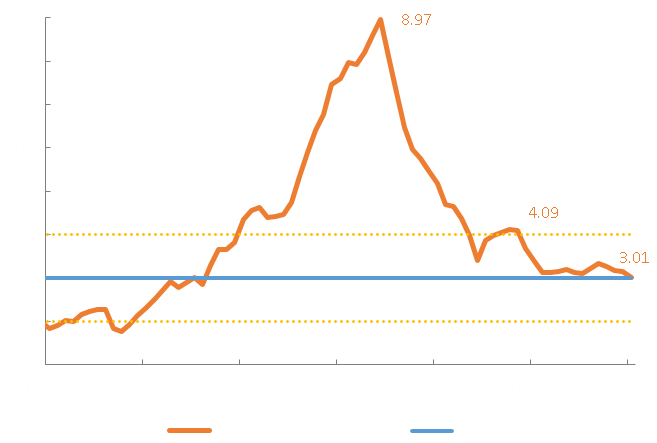
An early drop in the inflation rate on consumer prices in 2018 was followed by an extended period of stability, boosting consumer purchasing power and giving businesses a favorable price outlook for investment decisions. The annual rate closed the year at 3.18%, close to the long-term target of 3.0% and 91 basis points below the 4.09% observed in 2017. This drop was concentrated between January and April, after which the inflation rate remained between 3.1% and 3.3% (Graph 4). |
|
Graph 4 |
||
 |
||
| Source: DANE and Banco de la República (Central Bank of Colombia). |
|
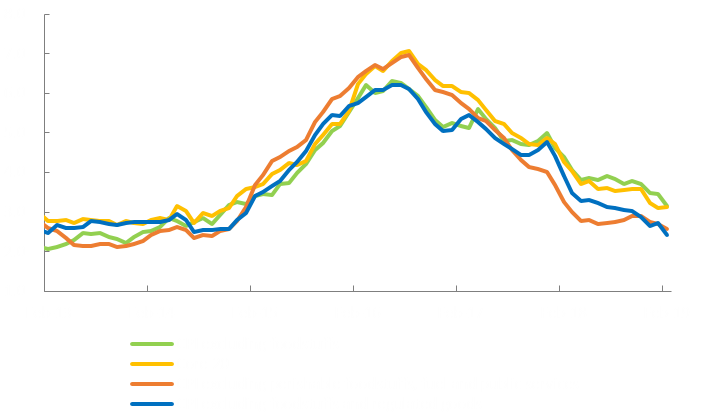
Core inflation also fell significantly, dropping from 4.66% in December 2017 to 3.03% at the end of 2018. This drop was also concentrated in the first quarter, though a significant unanticipated reduction also occurred in December. All core inflation indicators dropped significantly in 2018 (Graph 5). |
|
Graph 5 |
||
 |
||
| Source: DANE; Calculations by Banco de la República (Central Bank of Colombia). |
|
A close look at the consumer price index suggests that last year’s decline was driven by the non-food basket, where inflation fell from 5.01% at the end of 2017 to 3.48% at the end of 2018. Of the three components included in this basket – tradable, non-tradable and regulated goods – only the latter failed to contribute to the drop in inflation, increasing from 5.86% to 6.37% between 2017 and 2018. This was due to a rise in electricity and other public utility rates. |
1/ DANE introduced a new basket index for consumer prices in 2019. Nevertheless, to facilitate comparison to 2018, here we refer to the previous classification. |
| 3. Monetary Policy | |
|
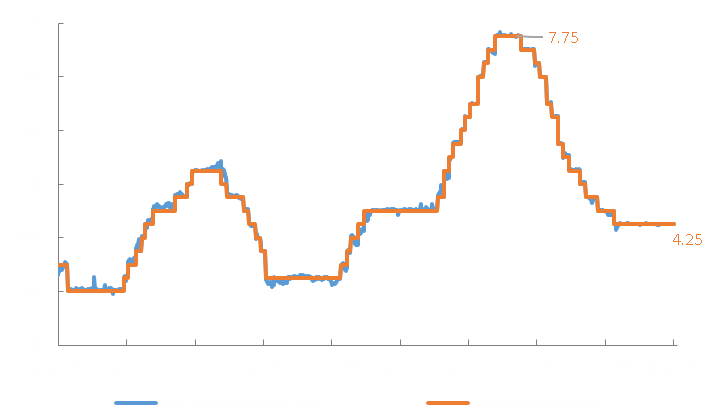
The Central Bank’s board of directors began gradually reducing interest rates in December 2016, lowering the policy rate from a peak of 7.75% to 4.75% by the end of 2017. In sessions in January and April 2018, the board made two more cuts of 25 basis points each, to 4.25%; interest rates have remained at this slightly expansionary level ever since. In sum, the Bank cut the policy rate by 350 basis points between December 2016 and April 2018, and in March marked 11 months without any alterations (Graph 6). The one-day interbank rate has also remained very close to the policy rate. |
|
Graph 6 |
||
 |
||
| Source: Banco de la República (Central Bank of Colombia). |
|
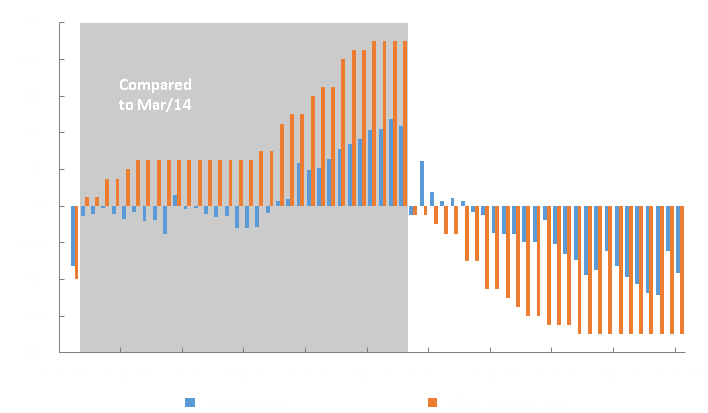
A significant portion of this accumulation of cuts was reflected in market interest rates in 2018. Rates on consumer credit dropped across all classes by 160 basis points over the course of the year, after previously having shown resistance to changes in the policy rate (Graph 7)[2]. After a small seasonal increase in January, consumer rates began to fall again in February 2019. Interest rates for both commercial credit and housing continued to drop in 2018 as well. |
|
|
Graph 7 |
||
 |
||
|
Source: Banco de la República (Central Bank of Colombia). |
| 4. International Context | |
|
The world economy grew by 3.7% in 2018, according to the most recent estimates from the International Monetary Fund (IMF)[3]. Global growth was led by positive momentum in the U.S. economy, which grew by 2.9% as a result of fiscal stimulus and an increase in private consumption, as well as by growth in China (6.6%). Latin America and the Caribbean grew by just 1.1%, making it one of the slowest-growing regions in 2018. |
3/ World Economic Outlook Update, January 2019. A Weakening Global Expansion. https://www.imf.org/en/Publications/WEO/Issues/2019/01/11/weo-update-january-2019 |
|
Graph 8 |
||
 |
||
|
Source: Banco de la República (Central Bank of Colombia). |
|
Graph 9 |
||
 |
||
|
Source: Bloomberg. |
| 5. Prospects for 2019 | |
|
Recovery in 2018 has laid the groundwork for continued acceleration in economic growth in 2019. This year we estimate GDP to expand by close to 3.5%, well above the 2% the IMF projects for Latin America as a whole. Our forecast envisions internal demand strengthening at a faster rate than in 2018, in part thanks to the positive impact of 2018 Financing Law on business investment.[4] |
4/ Businesses can now deduct VAT paid for the acquisition of capital goods from their revenue taxes, and deduct 50% of the tax on industry and commerce; the general income tax rate for businesses will drop to 33% in 2019, 32% in 2020, 31% in 2021 and 30% in 2022. |
| 6. Risks and Vulnerabilities |
|
|
Colombia’s economic outlook for 2019 looks promising. The economy will move toward equilibrium, in the sense that economic growth will get close to its potential, and inflation will wind up near the target rate. This future is not free from risks, however – both from abroad and from within. A. External Risks
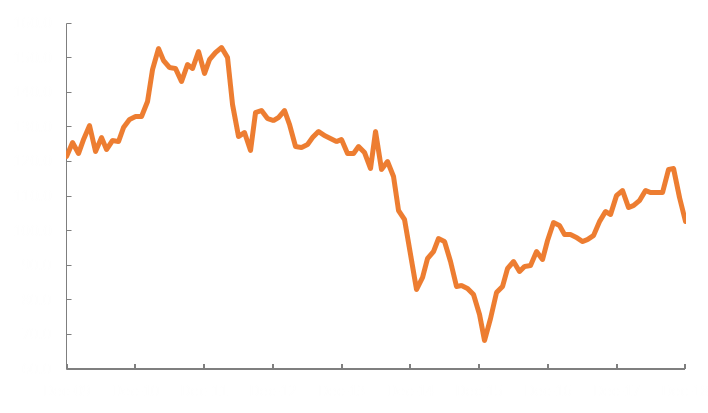
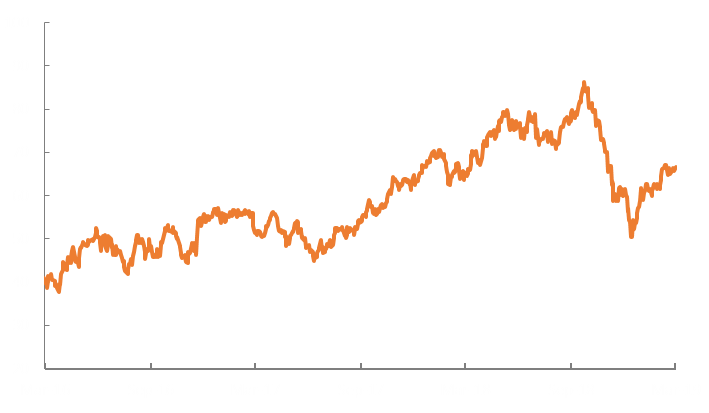
Toward the end of 2018, an increase in perceived risk in the world economy was reflected in volatility and declines in international stock markets. International liquidity conditions look likely to remain on track, however, following recent announcements from the Federal Reserve of the United States (FED) signaling a slowdown on interest rate hikes. Those announcements have broadly helped pacify markets, reducing risk premiums and leading to the recovery of some stock indices. In emerging markets like Colombia, this has helped the currency rebound after a significant depreciation in the last quarter of 2018.
B. The Current Account
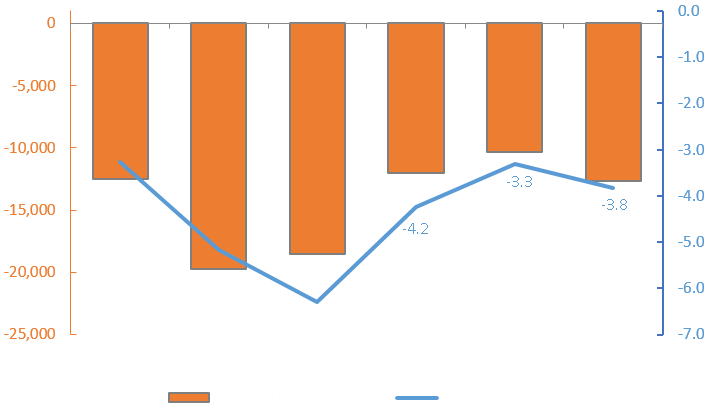
The current account on Colombia’s balance of payments fell drastically in response to the oil shock of 2014, increasing from a deficit of 3.3% of GDP in 2013 to 6.3% of GDP in 2015. This increase in Colombia’s external imbalance was driven by a reduction in the value of exports at the time. In 2016 and 2017, the external imbalance was corrected considerably, with the current account deficit falling to 4.2% and 3.3% of GDP, respectively. That correction came about initially from a significant reduction in imports and the remission of utilities abroad by international oil companies. However, the makeup of that adjustment changed in 2017, when exports rebounded and other external revenues outpaced the increase in imports. |
|
Graph 10 |
||
 |
||
|
Source: Banco de la República (Central Bank of Colombia). |
|
The technical team at the Bank forecasts the current account deficit to continue to grow, reaching a level slightly over 4.0% of GDP at the end of 2019 due to lower prices for Colombian coal and crude oil, as well as a moderation in the growth of exports of industrial goods (in the context of a global economic slowdown). Imports will continue to grow in 2019, though at a slower rate than in 2018. This is consistent with an environment in which internal demand grows more than GDP.
C. Public Finances
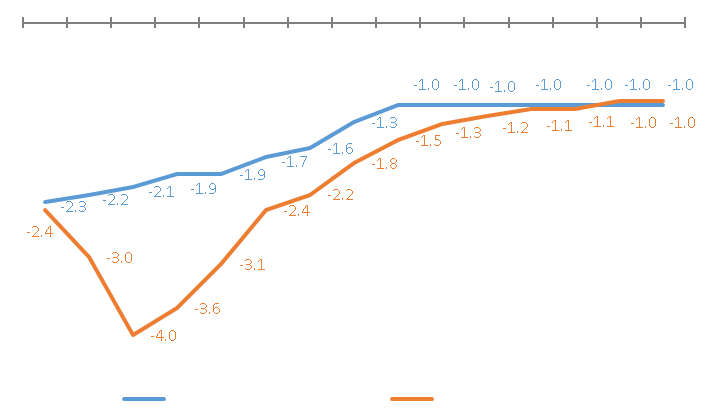
Colombia’s Fiscal Rule[6] requires the national government to gradually reduce the structural fiscal deficit until reaching a level of -1.0% of GDP or less by 2022. Since the rule has been in effect, it has enabled a reduction in the structural deficit from -2.3% of GDP in 2014 to -1.9% of GDP in 2018. |
|
|
Graph 11 |
||
 |
||
|
Source: Ministry of Treasury and Public Credit. |
|
The recent Financing Law introduced new challenges to complying with the fiscal rule. While changes in the tax code should stimulate investment and economic growth, after 2019 their effects will not be strong enough to compensate for the expected fall in revenues. |